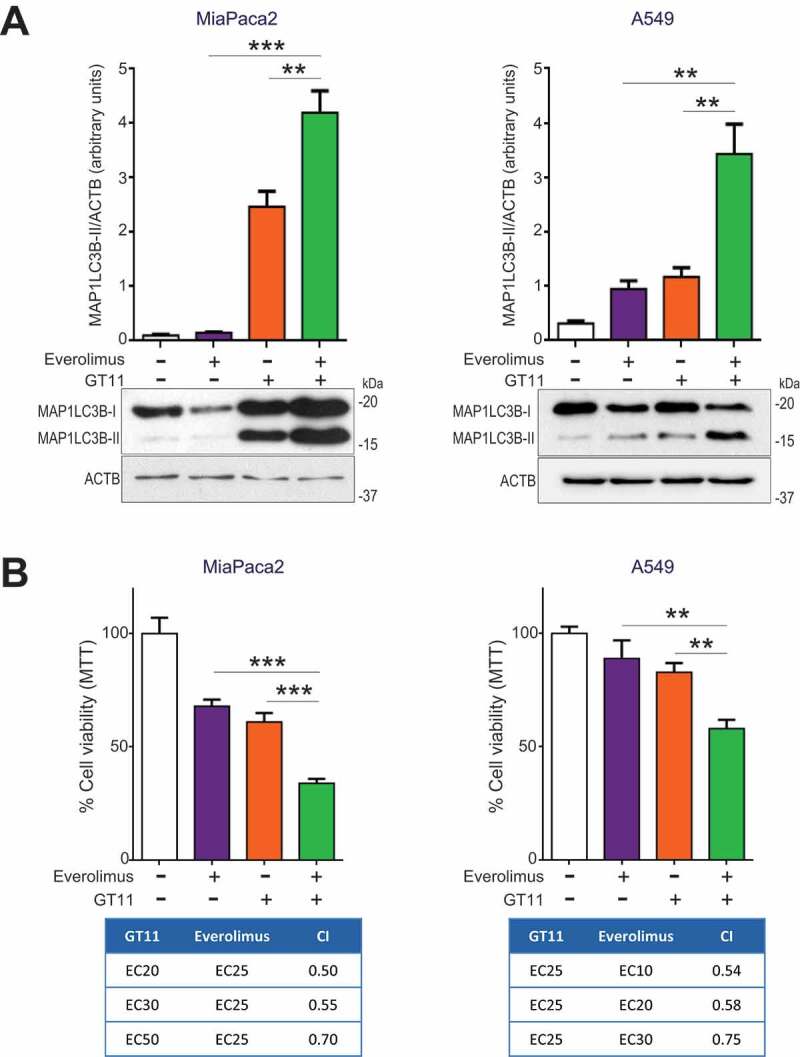
Figure 8.

DEGS1 inhibition collaborates with MTORC1 inhibition to promote autophagy and cancer cell death. (a) MiaPaca2 (left histogram) and A549 (right histogram) cells were treated with a combination of the DEGS1 inhibitor GT11 and the MTORC1 inhibitor everolimus for 24 h. Cell viability was determined by MTT assay. Each value is the mean ± SD of three different experiments. Lower tables show the combination index (CI) analysis for different concentrations of GT11 and everolimus. CIs were obtained using the indicated doses of inhibitors and the Compusyn software (see Methods Section) (CI > 1, antagonism; CI = 1, summary effect; CI < 1, synergism). Similar results were obtained in three separate determinations. (b) MiaPaca2 (left) and A549 (right) cells were treated with a combination of the DEGS1 inhibitor GT11 and the MTORC1 inhibitor everolimus for 24 h, then lysed. MAP1LC3B lipidation was visualized by immunoblotting. MAP1LC3B-II levels were normalized to ACTB levels and estimated by densitometric units. Similar results were obtained in three separate experiments. **, P < 0.005; ***, P < 0.001 from everolimus and GT11-treated cells, one-way ANOVA
