
Figure 4.
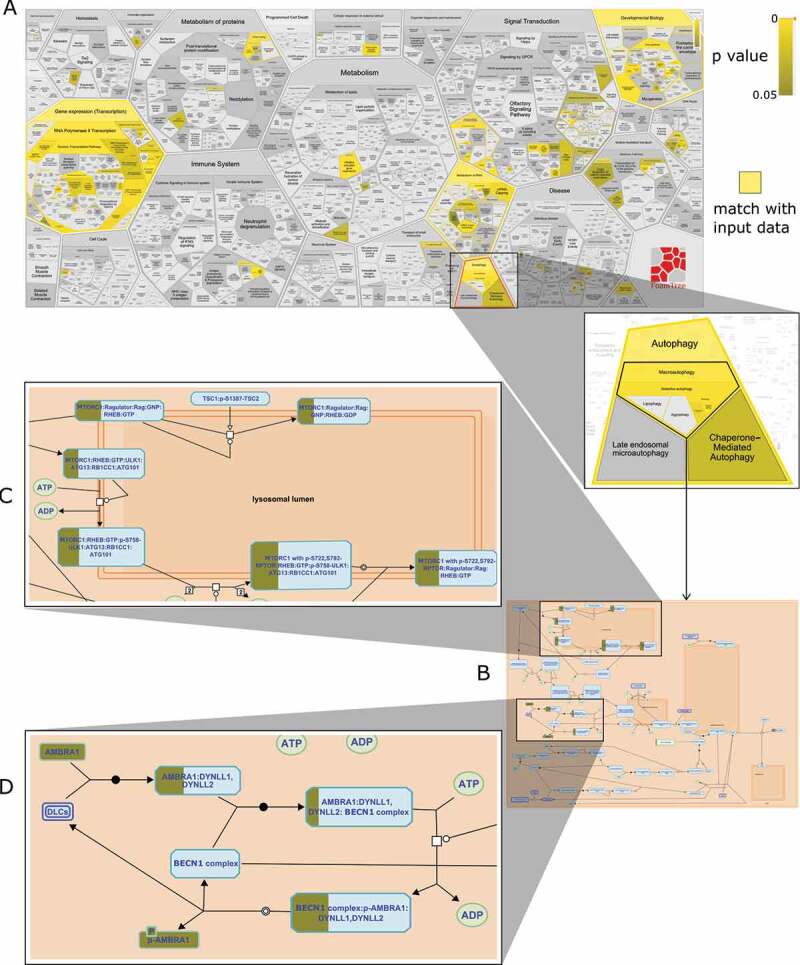
Reactome enrichment analysis of top 100 genes from GFP low vs. GFP high (autophagy activation) data from [21] (A) Distribution of 100 genes across Reactome pathway – yellow indicates matched entities and gradient represents significance (p-value) (B) Overlap of CRISPR-knocked out genes on the macroautophagy pathway (C) Macroautophagy inhibitory mechanisms – MTOR phosphorylation of ULK1 is significantly matched (D) Macroautophagy inhibitory mechanisms – AMBRA1 sequestering BECN1 complex is significantly matched