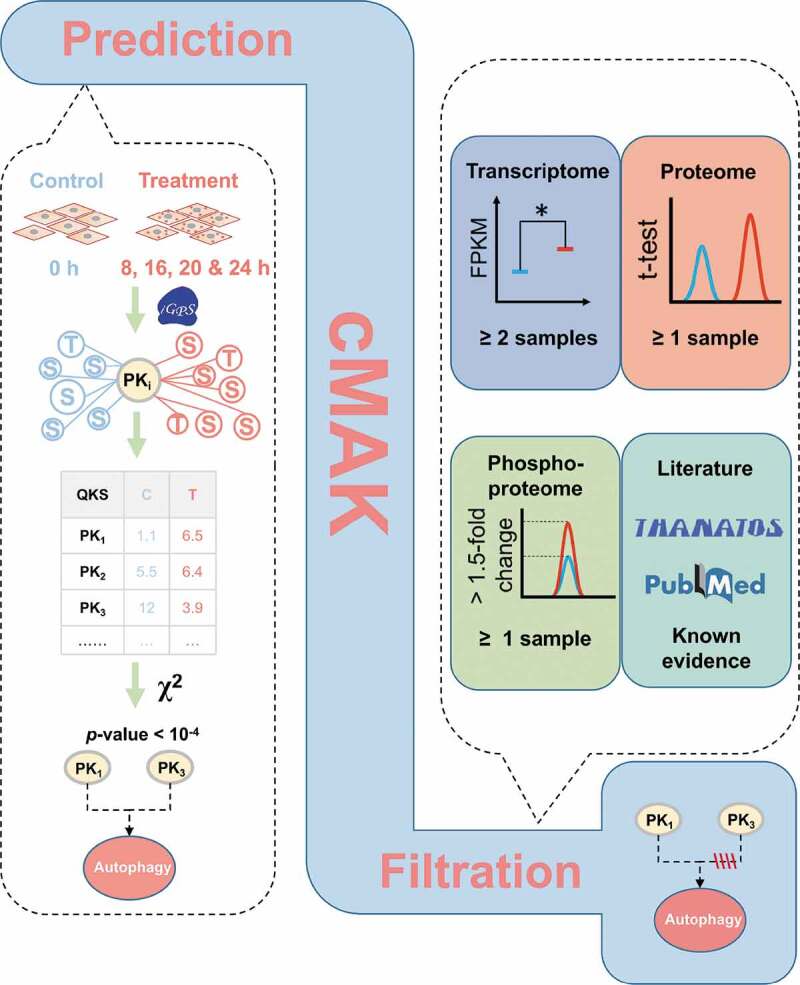
Figure 5.

The overview of the 3-step cMAK algorithm. First, ssKSRs were predicted for all quantified p-sites to pinpoint potential substrates for each kinase. Then, the QKS value of each kinase was calculated, and the total QKS score was summed up for each time point. The statistical significance was evaluated through Yate’s chi-squared test. Finally, the transcriptomic, proteomic, and phosphoproteomic data of predicted kinases, as well as the literature evidence, were considered to reduce potentially false-positive hits
