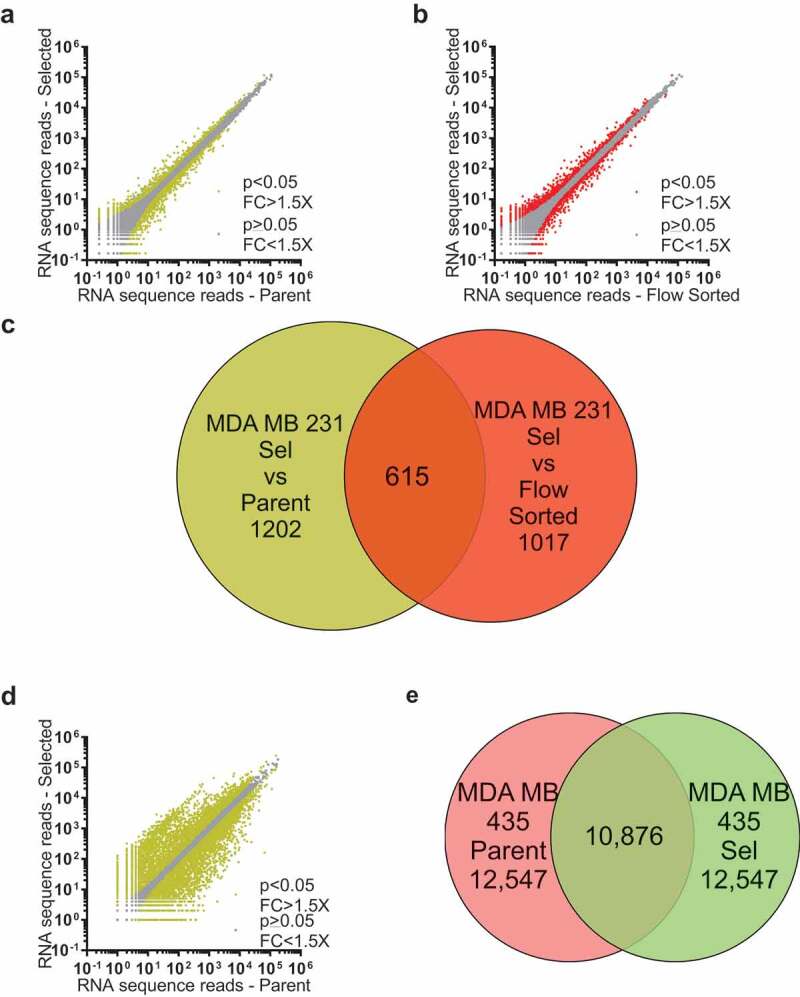
Figure 2.

RNA sequencing comparisons of MDA MB 231 Parent, Selected and Flow-Sorted cells, and MDA MB 435 Parent and Selected cells. (a). Log10-log10 scatter plots of mean RNAseq reads as described in Rudzka et al [27]. for Parent vs Selected MDA MB 231 cells, where p < 0.05 and fold-change (FC) differences > 1.5X indicated with yellow dots, p ≥ 0.05 or FC ≤ 1.5X indicated with grey dots. (b). Log10-log10 scatter plots of mean RNAseq reads for Flow-Sorted vs Selected MDA MB 231 cells, where p < 0.05 and FC > 1.5X indicated with red dots, p ≥ 0.05 or FC ≤ 1.5X indicated with grey dots. (c). Venn diagram indicating the 615 gene overlap (Table S3) between the 1817 genes that were different by p < 0.05 and FC > 1.5X between Parent and Selected MDA MB 231 cells (yellow circle; Table S1), and the 1632 genes that were different by p < 0.05 and FC > 1.5X between flow-sorted and selected MDA MB 231 cells (red circle; Table S2). (d). Log10-log10 scatter plots of mean RNAseq reads for Parent vs Selected MDA MB 435 cells, where p < 0.05 and FC > 1.5X indicated with yellow dots, p ≥ 0.05 or FC ≤ 1.5X indicated with grey dots. (e). Venn diagram indicating the 10,876 gene overlap (Table S4) that were different by p < 0.05 and FC > 1.5X between parent (red circle) and selected (green circle) MDA MB 435 cells
