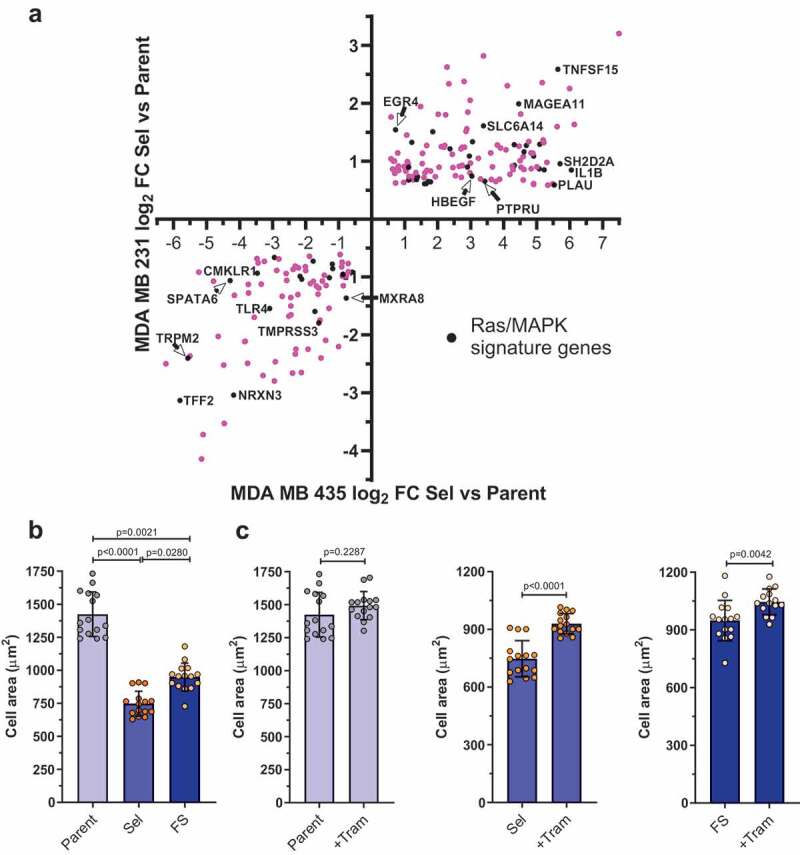
Figure 3.

Scatter plot of pore-invasion gene set expression differences between parent and pore-selected MDA MB 231 breast cancer cells versus parent and pore-selected MDA MB 435 melanoma cells. To visualize the distribution of the Ras/Raf/MEK/ERK MAPK regulated transcripts (black symbols) within the 214 invasion gene set (pink symbols; Table S5), the log2 fold change differences in expression between parent and pore-selected MDA MB 231 cells were plotted versus parent and pore-selected MDA MB 435 cells. (b). Graph depicts mean (± SEM) cell area for parental, selected and flow-sorted MDA MB 231 cells treated with DMSO. Statistical significance determined by Kruskal – Wallis followed by Dunn’s multiple comparison test. (c). Graphs depict mean (± SEM) cell area for Parental (left), Selected (centre) and Flow-Sorted (right) MDA MB 231 cells treated with DMSO or Trametinib (+Tram) as indicated. Each dot represents an average from n = 6 fields per well, from at least 200 cells per field. Data pooled from n = 3 independent experiments. Statistical significance determined by Mann – Whitney test
