
Figure 4.
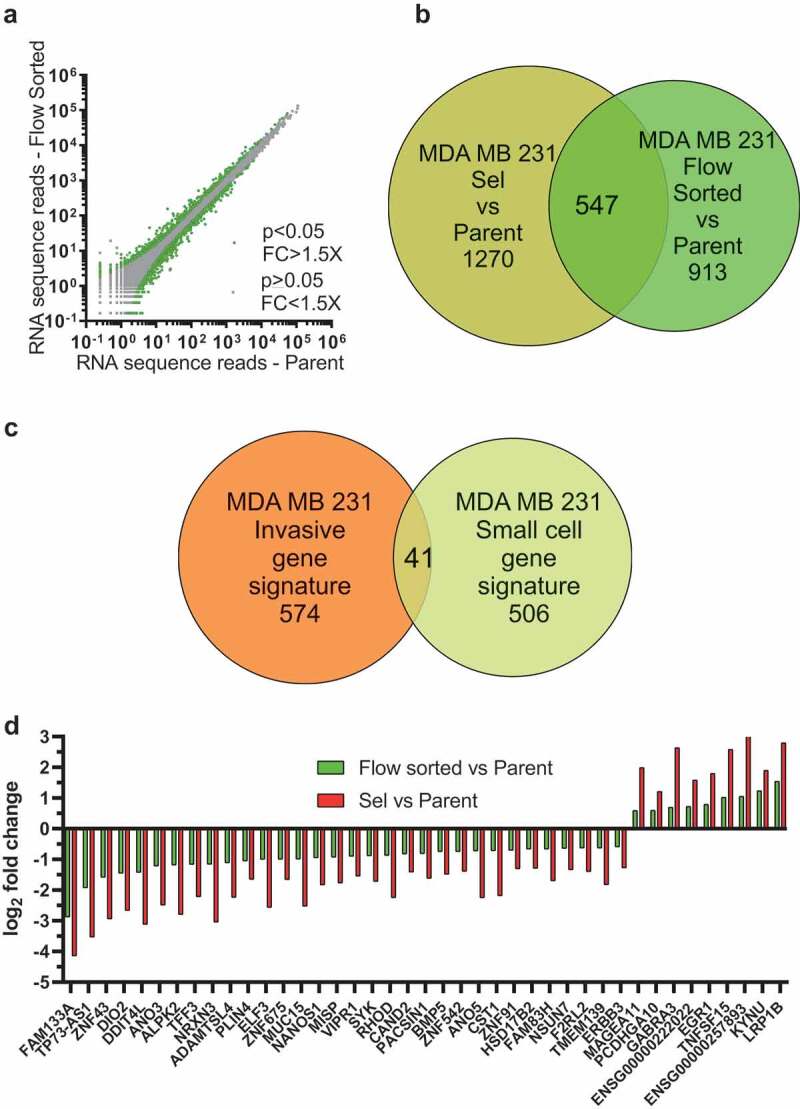
Identification of a small cell size gene set. (a). Log10-log10 scatter plots of mean RNAseq reads for Flow-Sorted vs Parent MDA MB 231 cells, where p < 0.05 and FC > 1.5X indicated with green dots, p ≥ 0.05 or FC ≤ 1.5X indicated with grey dots. (b). Venn diagram indicating the 547 gene overlap (Table S10) between the 1817 genes that were different by p < 0.05 and FC > 1.5X between Parent and Selected cells (olive green circle; Table S1), and the 1460 genes that were different by p < 0.05 and FC > 1.5X between Flow-Sorted and Parent MDA MB 231 cells (light green circle; Table S9). (c). Venn diagram indicating the 41 gene overlap (Table S11) between the 615 invasive gene signature set (Table S3) and the 547 small cell size gene signature set (Table S10). (d). To visualize the fold-change differences in gene expression for the 41 common transcripts identified in the pore-invasion and small cell size gene signature sets (Table S11), log2 fold change differences between Parent and Flow-Sorted MDA MB 231 cells (green bars) and between Parent and Pore-Selected MDA MB 231 cells (red bars) were plotted