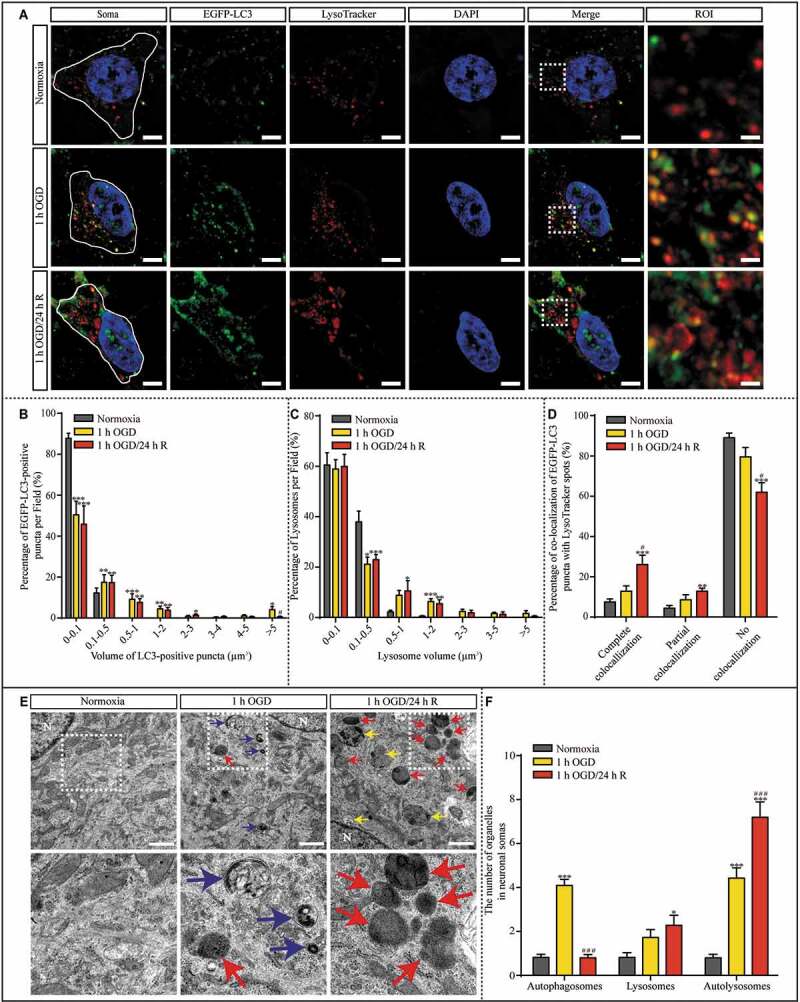
Figure 3.

The number and volume of lysosomes increased in cultured hippocampal neurons after 1 h OGD/R 24 h exposure. (A) Representative SIM images of hippocampal neurons are shown. Lenti-EGFP-LC3-transfected neurons were counterstained with DAPI and LysoTracker; scale bar: 5 μm, High-magnification images of the boxed areas are shown in the inserts (ROI); scale bar: 1 μm. (B and C) The percentage of LC3-positive puncta and LysoTracker-positive puncta with a volume in the indicated ranges per neuron was quantified with Imaris software in randomly chosen neurons from each sample in each group. (D) The percentages of LysoTracker-positive puncta showing complete, partial, and no colocalization with LC3-positive puncta per neuron were quantified. (E) Representative TEM images of autophagosomes (blue), autolysosomes (yellow), and lysosomes (red) in the cytoplasm of neurons are presented; N: nucleus; scale bar: 1 μm and (F) quantified per TEM field from 40 randomly selected fields. (B, C and D, normoxia: n = 7; 1-h OGD: n = 8; 1-h OGD/24-h R: n = 9; F, n = 40; *p < 0.05, **p < 0.01, ***p < 0.001 vs. the normoxia group; #p < 0.05, ###p < 0.001 vs. the 1-h OGD group). Statistical comparisons were carried out with one-way ANOVA. Data are shown as the mean ± SEM
