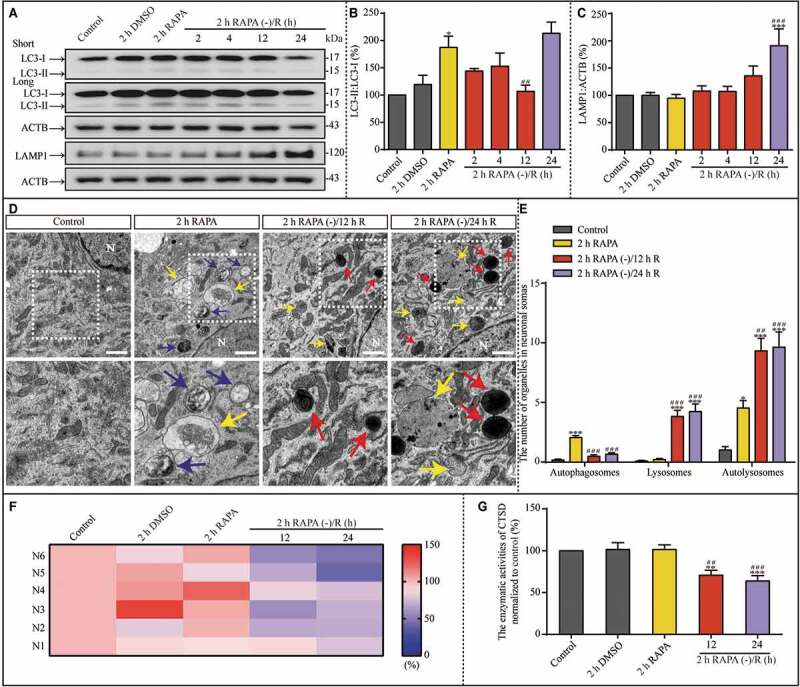
Figure 5.

RAPA-induced autophagy upregulation is followed by lysosomal accumulation in the subsequent culture without RAPA. (A-C) Representative western blots and the quantitative analysis of LC3 and LAMP1 in the indicated groups. ACTB was used as the loading control. (D and E) Representative TEM images and the quantitative analysis of autophagosomes, lysosomes, and autolysosomes in the indicated groups. N: nucleus; scale bar: 1 μm. (F and G) The enzymatic activity of CTSD in the indicated groups was evaluated with a Fluorometric Assay Kit from Abcam. N1-N6 indicated that this experiment was replicated 6 times. The activities of enzymatic activity of CTSD were normalized to those of normoxia and shown as the ratio (0–150). Blue, yellow, or red arrowheads indicate representative autophagosomes, autolysosomes, or lysosomes, respectively. (B, n = 5; C, n = 6; E, control, n = 24; 2 h RAPA, n = 34; 2 h RAPA (-)/12 h R, n = 38; 2 h RAPA (-)/24 h R, n = 35; G, n = 6; *p < 0.05, **p < 0.01, ***p < 0.001 vs. the control group; ##p < 0.01, ###p < 0.001 vs. the 2 h RAPA group). Statistical comparisons were carried out with one-way ANOVA. Data are shown as the mean ± SEM
