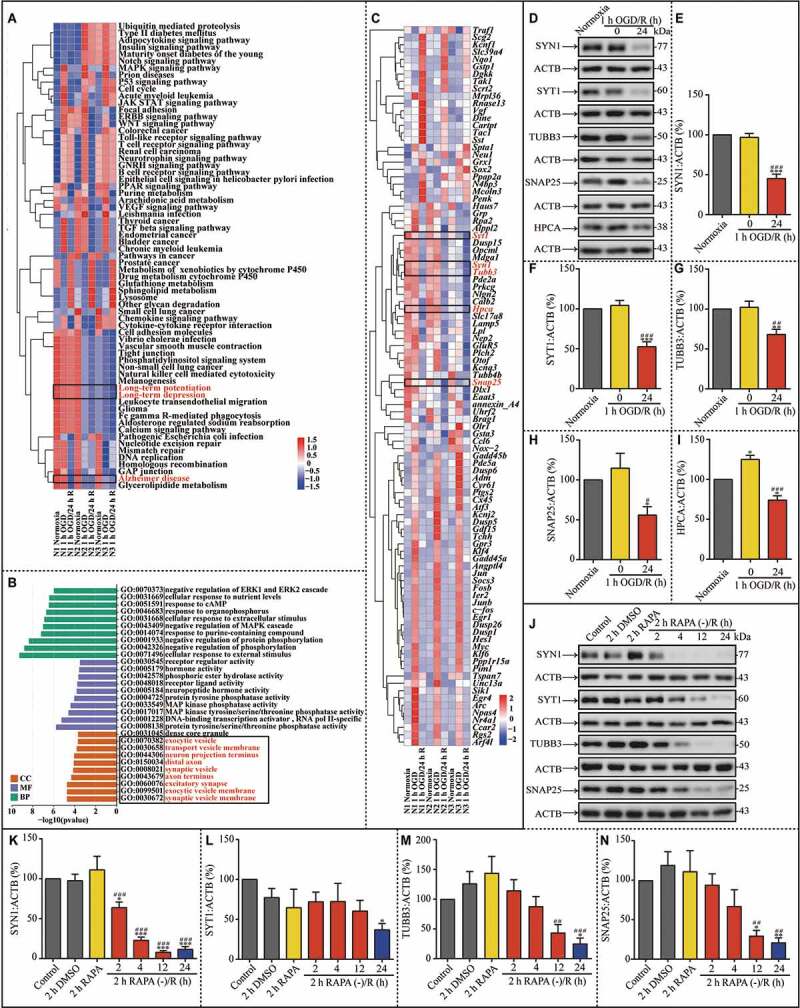
Figure 8.

The turnover of synaptic proteins is impaired after 1 h OGD/24 h reperfusion; these changes are partially mimicked by RAPA treatment. (A) Heat map of key KEGG pathways of the DEGs in the indicated groups. The rows are samples in different groups and the columns are the KEGG pathways. N1-N3 indicated the number of replicated times. (B) Results of GO enrichment analysis of DEGs are presented in the indicated groups. Abscissa is the enriched GO, and ordinate is the number and ratio of DEGs. Different colors indicate different GO classes, namely molecular function, biological process, and cellular component. (C) Heat map of the selected 98 DEGs in the indicated groups. Each row indicates a sample and each column a gene. Red represents upregulated genes and blue downregulated ones. (D-I) Representative western blots and quantitative analysis of SYN1, SYT1, TUBB3, SNAP25 and HPCA in the indicated groups (E, n = 10; F, n = 9; G, n = 5; H, n = 5; I, n = 3; *p < 0.05, **p < 0.01, ***p < 0.001 vs the normoxia group; #p < 0.05, ##p < 0.01, ###p < 0.001 vs 1-h OGD group). (J-N) Representative western blots and quantitative analysis of SYN1, SYT1, TUBB3 and SNAP25 in neurons after RAPA treatment or after the subsequent culture without RAPA (K, n = 6; L, n = 4; M, n = 5; N, n = 5; *p < 0.05, **p < 0.01, ***p < 0.001 vs the control group; ##p < 0.01, ###p < 0.001 vs rapa group). ACTB was used as the loading control. Statistical comparisons were carried out with paired t-tests in the DEGs selected experiment, and with one-way ANOVA in the western blotting experiment. Data are shown as the mean ± SEM
