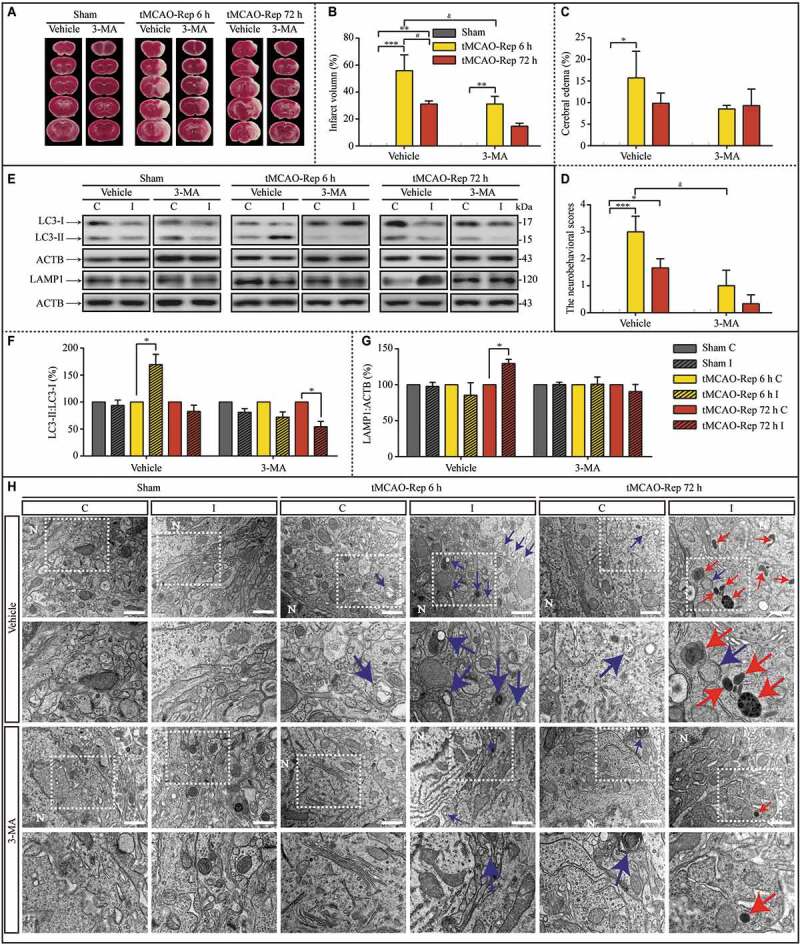
Figure 10.

3-MA pretreatment via the intracerebroventricular (i.c.v) injection alleviated ischemic injuries induced by 1 h MCAO insults during subsequent reperfusion. (A) Representative images of TTC-stained cerebral coronal sections of mice in sham, tMCAO-Rep 6 h, and tMCAO-Rep 72 h with or without 3-MA. Quantification of brain infarct volume (B), cerebral edema (C), and neurobehavioral scores (D) in tMCAO-Rep 6 h and tMCAO-Rep 72 h mouse (B-D, n = 3; *p < 0.05, **p < 0.01, ***p < 0.001 vs. the indicated sham group; #p < 0.05 vs. tMCAO-Rep 6 h group; &p < 0.05 vs. vehicle+tMCAO-Rep 6 h group). Statistical comparisons were carried out with one-way ANOVA. (E-G) Representative western blots and the quantitative analysis of the LC3-II:LC3-I ratio and LAMP1 with or without 3-MA in the indicated groups. I: ipsilateral, C: contralateral. (F, Vehicle+tMCAO-Rep 6 h, n = 4 and n = 3 in other groups; *p < 0.05 vs. the contralateral group). Statistical comparisons were carried out with paired t-tests. (H) Representative TEM images of the number of autophagosomes, lysosomes, and autolysosomes in the cytoplasm of neurons exposed to sham, tMCAO-Rep 6 h, and tMCAO-Rep 72 h; scale bar: 1 μm. Blue or red arrowheads indicate representative autophagosomes or lysosomes, respectively. (vehicle Sham C/I, n = 49/43; 3-MA+Sham C/I, n = 41/38; Vehicle+tMCAO-Rep 6 h C/I, n = 24/40; 3-MA+tMCAO-Rep 6 h C/I, n = 44/37; Vehicle+tMCAO-Rep 72 h C/I, n = 41/45; 3-MA+tMCAO-Rep 72 h C/I, n = 40/48 each groups; *p < 0.05, ***p < 0.001 vs. the contralateral group). Statistical comparisons were carried out with unpaired t-tests. For quantitative analysis of the TEM images, see Figure S10. Data are shown as the mean ± SEM
