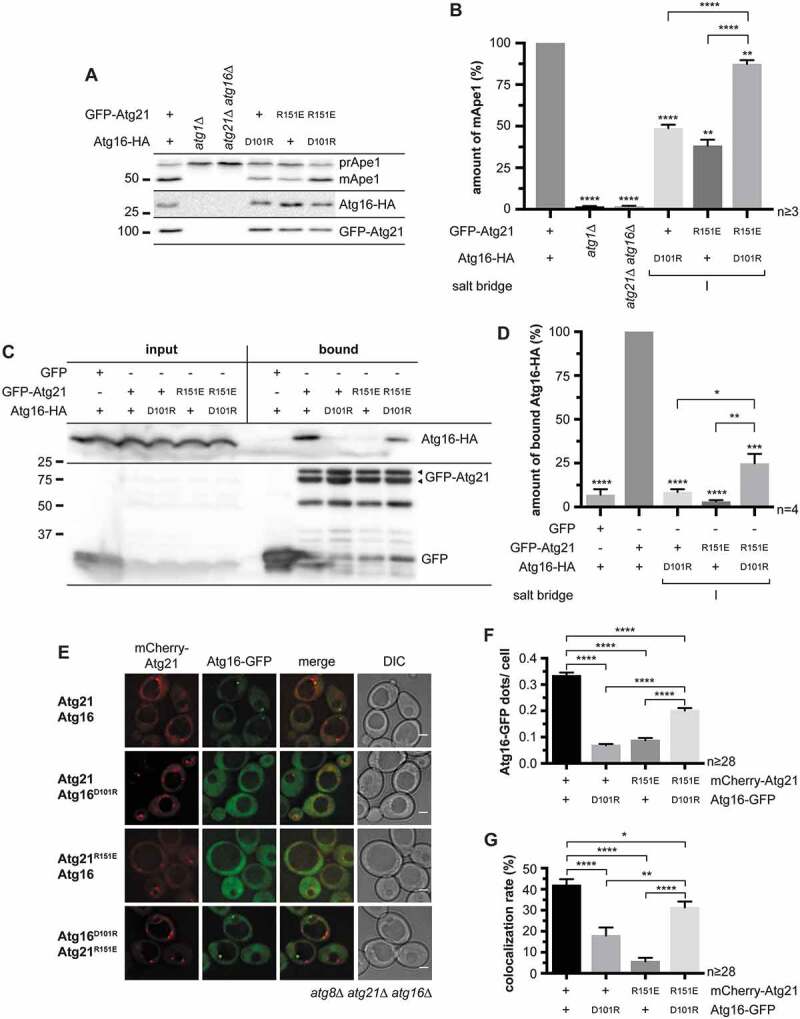
Figure 2.

Analysis of the potential salt bridge between ScAtg21 R151 and ScAtg16 D101 (salt bridge I). (A – G) Effect of charge-change mutations of ScAtg21 R151 and ScAtg16 D101 (salt bridge I) under early stationary conditions. (A) Effect on the prApe1 maturation. (B) Quantification of the ratio of mApe1 to the total amount of Ape1 measured in (A) from ≥ three independent experiments. The amount of mApe1 of the WT was set to 100%. (C) Effect on the interaction of GFP-Atg21 and Atg16-HA using co-immunoprecipitations. (D) Quantification of (C) from ≥ four independent experiments. The amount of bound Atg16-HA was normalized to the amount of bound GFP-Atg21. The WT was set to 100%. (E) Effect on the localization of Atg16-GFP. (F and G) The number of Atg16-GFP dots per cell (F) and the number of mCherry-Atg21 dots colocalizing with Atg16-GFP (G) were determined. In four independent experiments, ≥ 28 images (n) were evaluated (≥ 1182 cells per strain). Data are presented in mean ± SEM. Statistical relevance related to the WT was determined using the one-sample t-test. Different strains were directly compared (squared bracket) using the unpaired two-tailed t-test: * p < 0.05; ** p < 0.01; *** p < 0.001; **** p < 0.0001. n: number of independent experiments if not stated differently. The molecular weight marker is in kDa and scale bars represent 2 µm. DIC: differential interference contrast
