Figure 5.

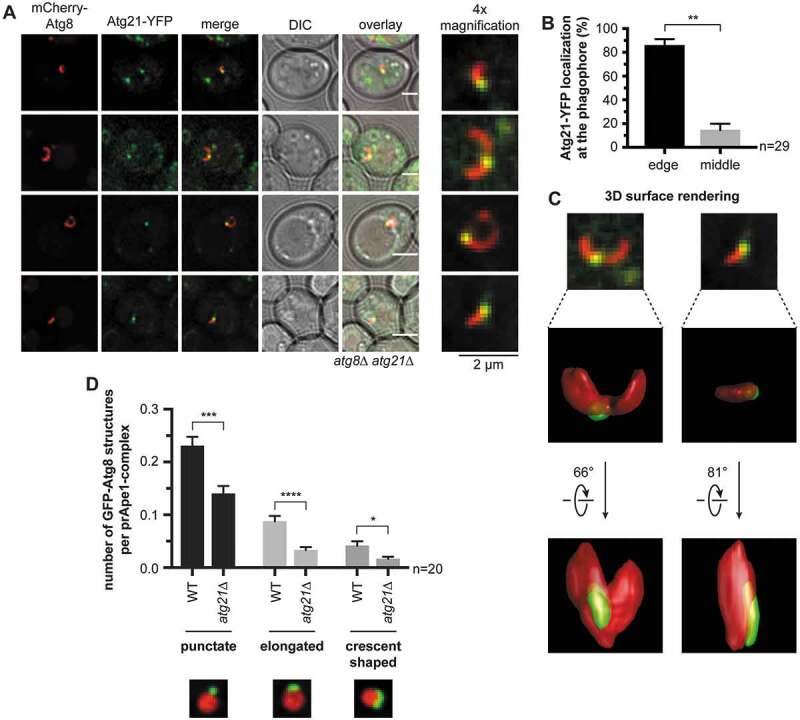
Atg21 localizes to the VICS. (A) Distribution of Atg21 at the phagophore. In an atg8∆ atg21∆ strain, plasmid-encoded mCherry-ATG8 and ATG21-YFP were expressed using their endogenous promoters. The APE1-overexpressing cells were analyzed after 1 h of starvation in SD-N. Scale bars: 2 µm. DIC: differential interference contrast. (B) Quantification of the localization of the Atg21-YFP puncta at the mCherry-Atg8-positive phagophores in (A). In three independent experiments, 29 images (n) were analyzed, resulting in 54 counted phagophores. (C) 3-dimensional reconstruction from the collected z-stacks of the respective mCherry-Atg8-positive phagophores of (A) using Huygens Professional. Arrows indicate rotation angles between the depicted views. (D) Effect of ATG21 deletion on the formation of the phagophore in APE1-overexpressing cells after 1 h starvation. In the atg8∆ APE1-RFP (WT) or the atg8∆ APE1-RFP atg21∆ (atg21∆) strain, plasmid-encoded GFP-ATG8 was expressed using its endogenous promoter. In two independent experiments with ≥ 1001 counted cells per strain, the colocalization of GFP-Atg8-positive structures with prApe1 complexes was determined. The shape of the colocalizing GFP-Atg8 structures was grouped into punctate, slightly elongated, and crescent-shaped. The colocalization rate of each group per prApe1 complex was calculated. Data are presented in mean ± SEM. Statistical relevance was determined using the unpaired two-tailed t-test: * P < 0.05; ** P < 0.01; *** P < 0.001; **** P < 0.0001. n: number of analyzed images per strain
