
Figure 8.
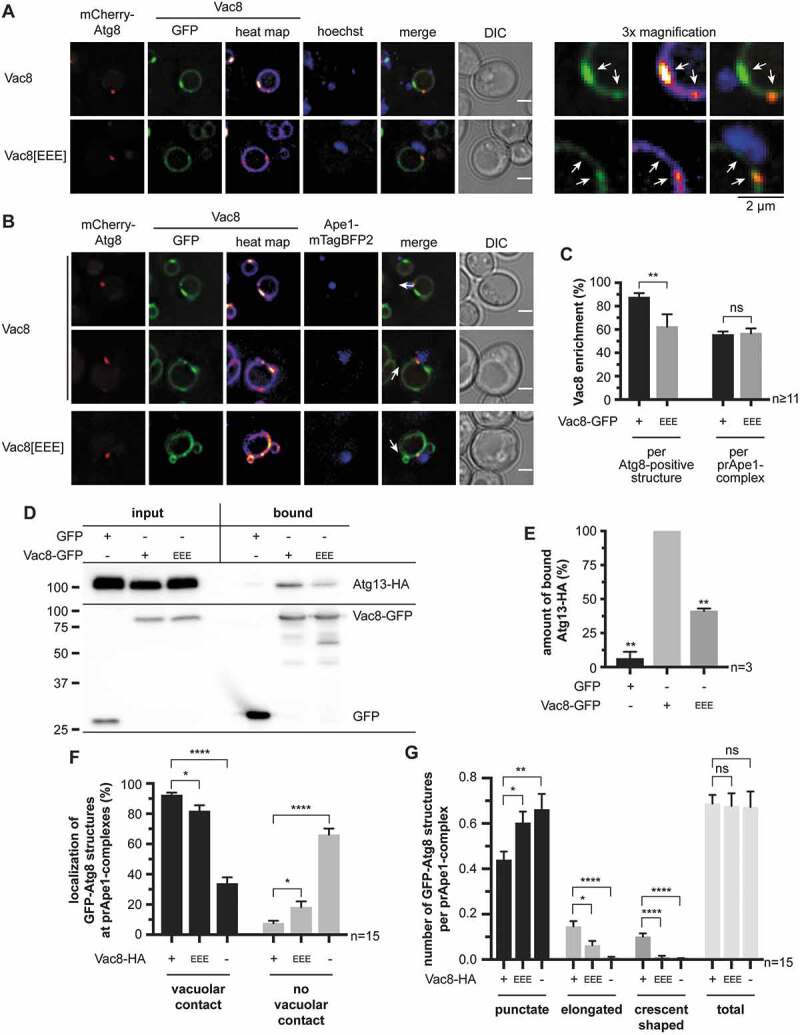
Efficient phagophore growth requires Vac8 and its interaction with Atg13. (A-C) Effect of charge-change mutation of R276 R317 R359 in the Atg13/Nvj1-binding region of Vac8 (Vac8[EEE]) on the distribution of Vac8-GFP at the vacuolar membrane. Analysis was done in APE1-overexpressing cells after 1 h of starvation. White arrows highlight Vac8-enriched regions. (A) Distribution of Vac8-GFP in relation to the nucleus. In an atg8∆ vac8∆ strain, plasmid-encoded mCherry-ATG8 and VAC8-GFP or VAC8[EEE]-GFP were expressed using their endogenous promoters. The nucleus was visualized using Hoechst 33324. (B) Distribution of Vac8-GFP in relation to the phagophore and the prApe1 complex. In an atg8∆ vac8∆ APE1-mTagBFP2 strain, plasmid-encoded mCherry-ATG8 and VAC8-GFP or VAC8[EEE]-GFP were expressed using their endogenous promoters. (C) Quantification of the number of Vac8-enriched regions at the vacuolar membrane in proximity with the mCherry-Atg8-positive phagophores or the prApe1-mTagBFP2 complexes of (B). ≥ 11 images (n) with ≥ 24 mCherry-Atg8-positive structures per strain were analyzed. (D) Effect of the Vac8[EEE]-GFP mutant on the interaction with Atg13-HA using co-immunoprecipitations. (E) Quantification of (D) in three independent experiments (n). The amount of bound Atg13-HA was normalized to its amount in the input fraction and to the amount of bound GFP, Vac8-GFP, or Vac8[EEE]-GFP, respectively. The WT was set to 100%. (F and G) Effect of the Vac8[EEE] mutant on the vacuolar contact (F) and the formation of the phagophore (G). In an atg8∆ vac8∆ APE1-mTagBFP2 strain plasmid-encoded GFP-ATG8 and VAC8-HA or VAC8[EEE]-HA were expressed using their endogenous promoters. Furthermore, an atg8∆ vac8∆ APE1-mTagBFP2 strain carrying an empty vector (-) was analyzed. The vacuolar membrane was visualized using FM 4–64. Analysis was done in APE1-overexpressing cells after 1 h of starvation. In total, 15 images (n) with ≥ 390 cells per strain were analyzed. (F) Quantification of the number of GFP-Atg8-positive structures of each strain with and without contact with the vacuolar membrane. (G) Quantification of the phagophore growth by grouping the GFP-Atg8-positive structures into punctate, slightly elongated, and crescent-shaped and calculating the colocalization rate of each group per prApe1 complex. Data information: data are presented in mean ± SEM. Statistical relevance related to the WT was determined using the one-sample t-test. Different strains were directly compared (squared brackets) using the unpaired two-tailed t-test: ns, not significant p > 0.05; * p < 0.05; ** p < 0.01; **** p < 0.0001. Scale bars: 2 µm. DIC: differential interference contrast