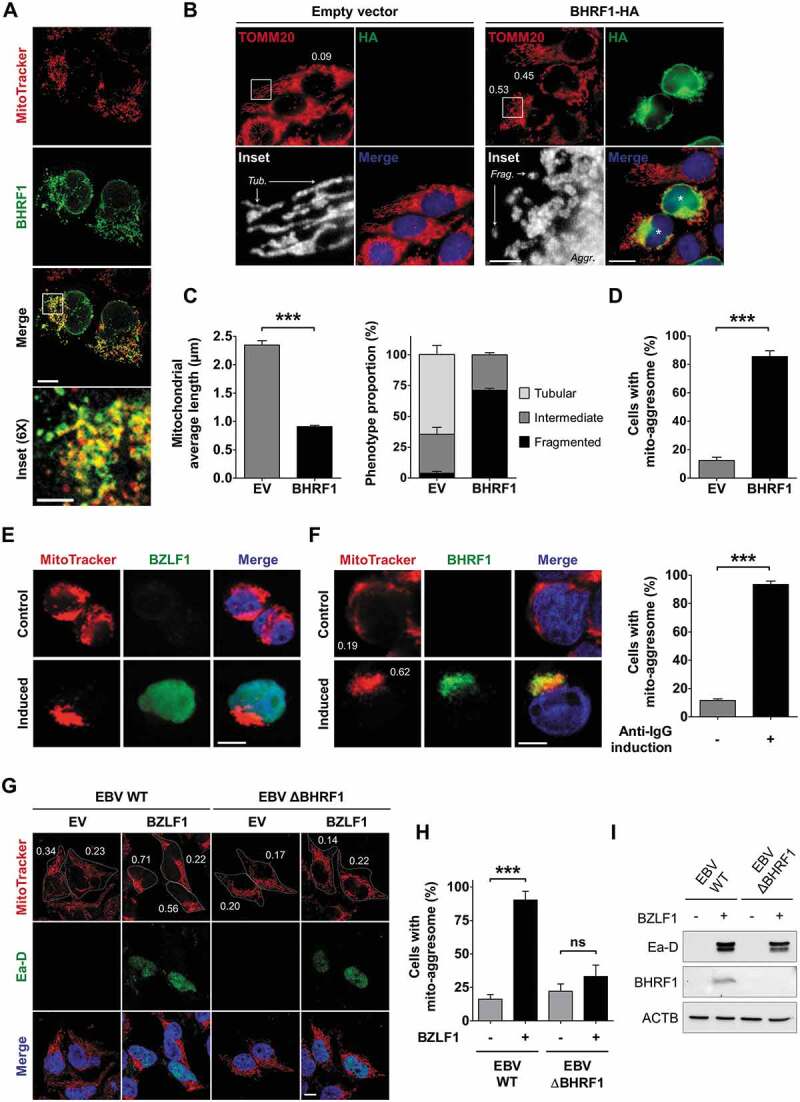
Figure 1.

BHRF1 induces the formation of mito-aggresomes in HeLa cells and EBV-reactivated cells. (A) BHRF1 localizes to the mitochondria. Confocal images of BHRF1-HA-transfected HeLa cells immunostained for BHRF1 and the mitochondria (MitoTracker). Scale bars: 10 µm, and 3 µm for inset. (B-D) BHRF1 induces mitochondrial fission in HeLa cells. Cells were transfected with an empty vector (EV) or a plasmid encoding BHRF1-HA for 24 h. Cells were fixed and immunostained for TOMM20 to visualize the mitochondrial network, and HA to visualize BHRF1-expressing cells. Nuclei were subsequently stained with DAPI. (B) Representative images. Scale bars: 20 µm and 4 µm for insets. Tub., tubular mitochondria; Frag., fragmented mitochondria; Aggr., aggregated mitochondria. Values of mitochondrial compaction index (CI) are indicated on representative cells; cells indicated by a star (*) present a mito-aggresome (CI above 0.4). For details on CI scoring, see Figure S1C. (C) Left: mitochondrial average length. Right: mitochondrial phenotype. (D) Percentage of cells presenting a mito-aggresome. (E and F) EBV reactivation in B cells induces mito-aggresome formation. EBV-reactivated Akata cells were labeled with MitoTracker to visualize the mitochondrial phenotype and reactivated cells were detected by labeling EBV antigens. Nuclei were stained with Hoechst. Scale bar: 10 µm. (E) Confocal images of MitoTracker and BZLF1 co-staining. (F) Left: confocal images of MitoTracker and BHRF1 co-staining. Values of mitochondrial CI are indicated on representative cells. Right: percentage of EBV-reactivated Akata cells presenting a mito-aggresome. (G-I) EBV reactivation in the absence of BHRF1 blocks mito-aggresome formation in epithelial cells. (G) Confocal images of MitoTracker and Ea-D viral protein co-staining of HEK293 cells without reactivation (EV) or after reactivation (BZLF1 transfection). Nuclei were stained with DAPI. Scale bar: 10 µm. CI values are indicated on representative cells. (H) Percentage of cells presenting a mito-aggresome (CI above 0.4). (I) Immunoblot analysis of Ea-D and BHRF1 after BZLF1 transfection, confirming EBV reactivation in both cell lines and the lack of BHRF1 expression with the mutant virus. ACTB was used as a loading control. Data represent the mean ± SEM of three independent experiments. ns = non-significant; *** P < 0.001 (Student’s t-test)
