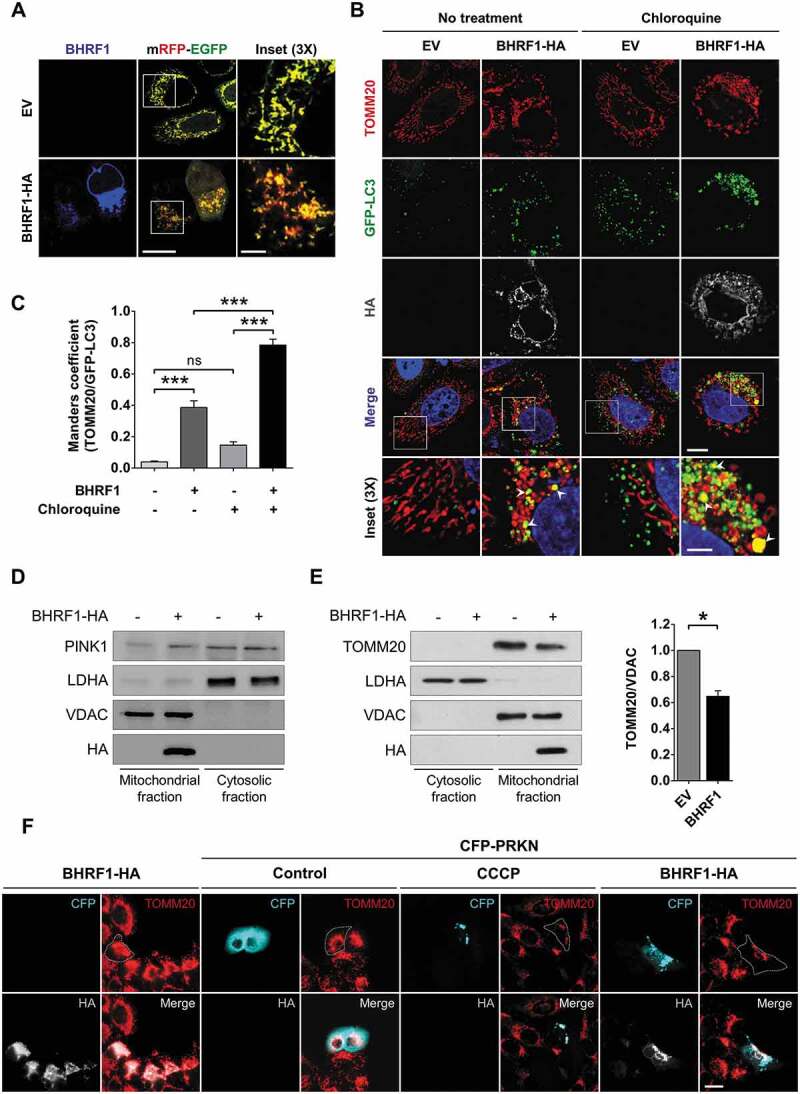
Figure 5.

BHRF1 induces mitophagy and recruits PRKN to the mitochondria. (A) Representative images of HeLa cells co-transfected for 24 h with the mRFP-EGFP probe targeted to the mitochondria and EV or BHRF1-HA plasmids. Cells were immunostained for BHRF1. Insets show part of the cytoplasm at a higher magnification. Red staining corresponds to the delivery of mitochondria to the acidic compartments. Scale bars: 20 µm and 5 µm for insets. (B and C) GFP-LC3 HeLa cells were transfected with EV or BHRF1-HA plasmids for 24 h and treated with CQ when indicated. Cells were immunostained for TOMM20 and HA. Nuclei were stained with DAPI. (B) Representative images of cells. Insets show part of the cytoplasm at a higher magnification to better visualize colocalization (see arrows) between mitochondria (TOMM20) and autophagosomes (GFP-LC3), as assessed by confocal microscopy. Scale bars: 10 µm and 4 µm for insets. (C) Colocalization level (Manders split coefficient) between mitochondria and autophagosomes. (D and E) Subcellular fractionation of BHRF1-HA- and EV-transfected HeLa cells. VDAC and LDHA were used as markers for mitochondrial and cytosolic fractions, respectively. (D) Immunoblot analysis of PINK1 showing its accumulation at the outer mitochondrial membrane. Same subcellular fractionation experiment as Figure 2B (E). Left: immunoblot analysis of TOMM20. Right: quantification of TOMM20 expression in the mitochondrial fraction showing that BHRF1 decreases the TOMM20 protein level. (F) BHRF1 recruits CFP-PRKN to the mitochondria. Representative images of HeLa cells co-transfected with BHRF1-HA plasmid and either EV or CFP-PRKN plasmids for 48 h and immunostained for TOMM20 and HA. Treatment with CCCP was used as a positive control of mitophagy. Cells outline was drawn to better visualize the degradation of mitochondria under BHRF1 and CFP-PRKN expression. Scale bar: 20 µm. See Figure S5 for visualization of mitochondria inside LAMP1-positive vesicles in BHRF1-HA-expressing cells. Data represent the mean ± SEM of two independent experiments. (C) ns = non-significant; *** P < 0.001 (one-way ANOVA test). (E) * P < 0.05 (Student’s t-test)
