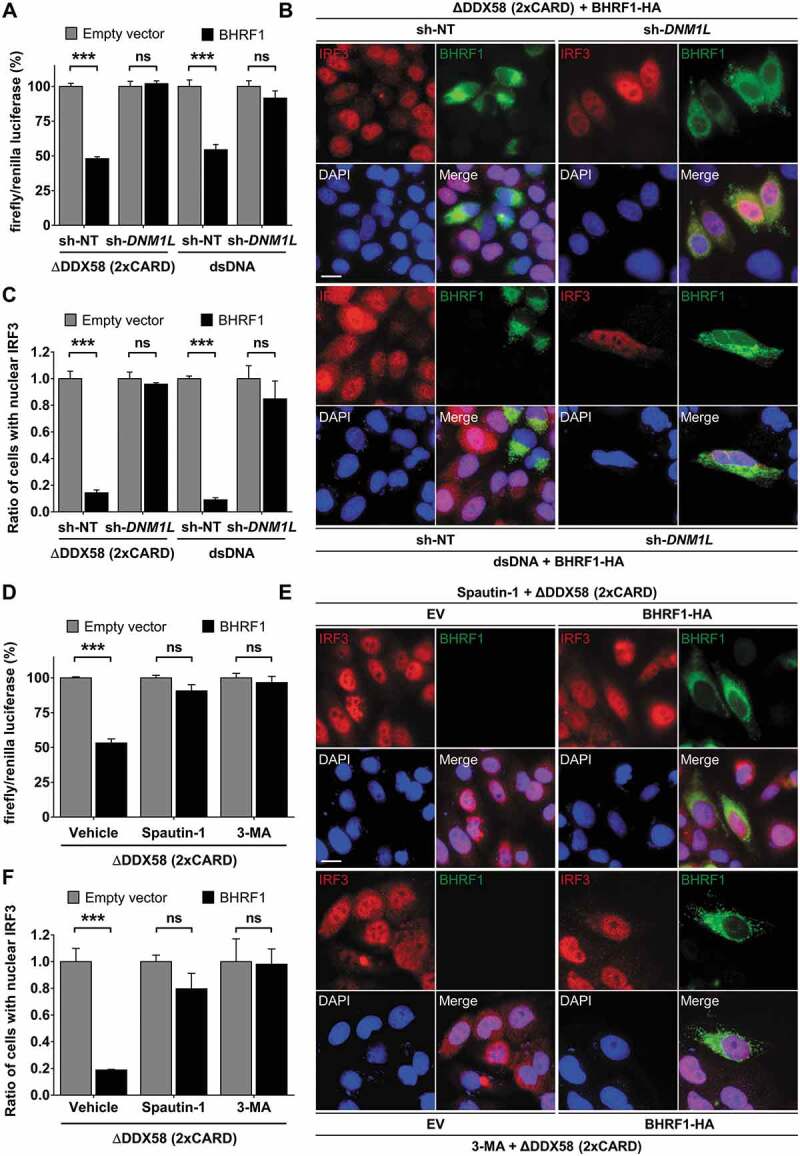
Figure 7.

Mitochondrial fission and autophagy are required for BHRF1-inhibitor effect on type I IFN induction. (A) Luciferase reporter assay on sh-DNM1L HEK293T or sh-DNM1L HeLa cells and their corresponding control cell lines (sh-NT). Cells were co-transfected with EV or BHRF1-HA, IFNB-Luc, and RL-TK plasmids for 24 h. HEK293T cells were also transfected with Flag-∆DDX58 (2xCARD) plasmid and HeLa cells were stimulated with dsDNA. Firefly/renilla luciferase ratios were calculated and normalized to control conditions (EV). (B and C) sh-NT and sh-DNM1L HeLa cells were transfected with EV or BHRF1-HA plasmids. Cells were also transfected with Flag-∆DDX58 (2xCARD) plasmid or stimulated with dsDNA and immunostained for IRF3 and BHRF1. Nuclei were stained with DAPI. (B) Representative images of BHRF1-HA-expressing cells. Scale bar: 20 µm. (C) Quantification of IRF3 nuclear localization, normalized to EV condition. (D) Luciferase reporter assay, as described in Figure 6A. HEK293T cells were transfected with Flag-∆DDX58 (2xCARD) plasmid to stimulate IFN production. To inhibit autophagy, cells were treated by Spautin-1 or 3-MA. Firefly/renilla luciferase ratios were calculated and normalized to control conditions (EV). (E and F) HeLa cells were co-transfected with Flag-∆DDX58 (2xCARD) and EV or BHRF1-HA plasmids. Cells were treated with Spautin-1 or 3-MA, and immunostained for IRF3 and BHRF1. Nuclei were stained with DAPI. (E) Representative images. Scale bar: 20 µm. (F) Quantification of IRF3 nuclear localization, normalized to EV condition. Data represent the mean ± SEM of three independent experiments. ns = non-significant; ** P < 0.01; *** P < 0.001 (Student’s t-test)
