Figure 5.

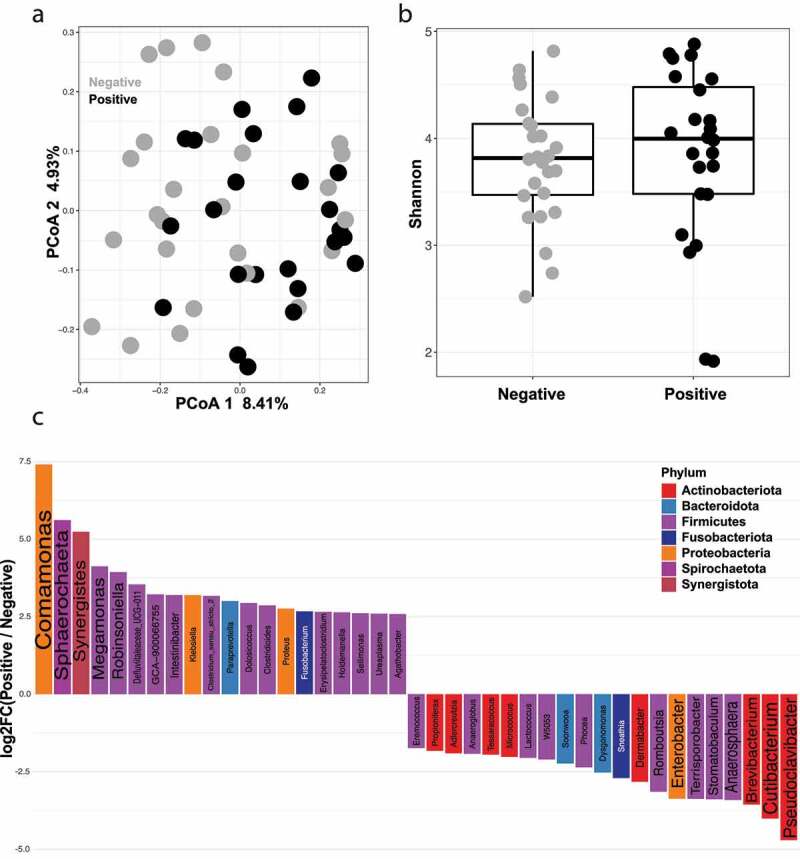
Presence of detectable SARS-CoV-2 virus in feces indicates differences in microbial composition among COVID-19 infected patients. (a) Principal coordinates analysis (PCoA) comparing beta diversity between SARS-CoV-2 qPCR positive (n = 24) and SARS-CoV-2 qPCR negative (n = 26) subjects. FDR-P = .03 (b) Shannon diversity index for SARS-CoV-2 qPCR positive (n = 24) and SARS-CoV-2 qPCR negative (n = 26) subjects. FDR P = .78 (c) Log fold change (logFC) plot of significantly (FDR-P < .05) enriched genera in SARS-CoV-2 qPCR positive and qPCR negative patients. Bars with positive values indicate enrichment in SARS-CoV-2 qPCR positive samples and bars with negative values indicate enrichment in controls SARS-CoV-2 qPCR negative samples. Only the top 75% of significantly enriched genera are shown. See Supplemental Table 5 for full list
