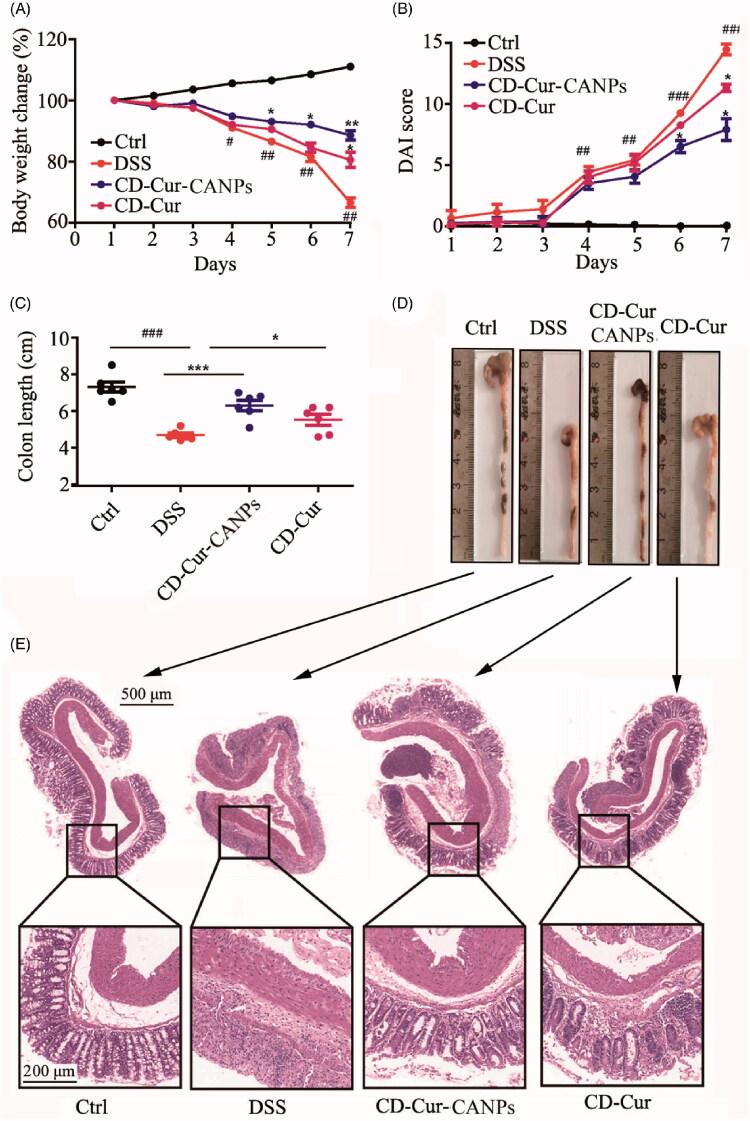
Figure 5.
CD–Cur–CANPs ameliorated DSS-induced colitis. (A) Change in body weight during experiment. (B) Change in DAI score of each group. (C and D) Change in colon length of each group. (E) Effect of CD–Cur–CANPs on colon pathological changes of DSS-induced colitis mice. Representative histological photos for each group. Scale bars, 500 μm (original magnification, 50×) and 100 μm (original magnification, 200×). Compared to control group, #p < 0.05, ##p < 0.01, ###p < 0.001. Compare to the DSS group, *p < .05, **p < .01, ***p < .001, na: no significance.

