Figure 2.

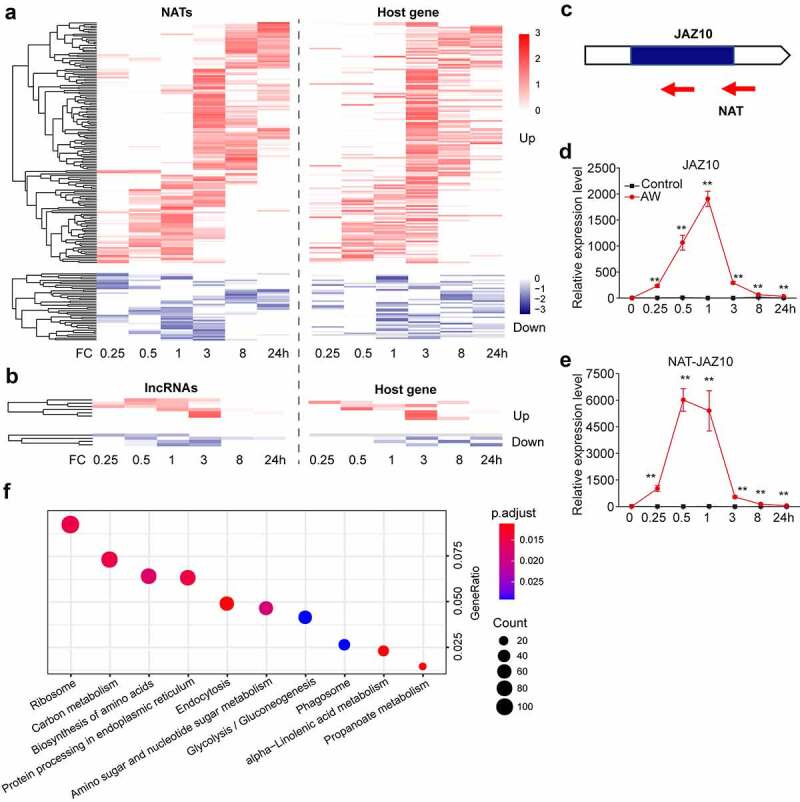
Prediction of cis effect of DE lncRNAs and the expression of JAZ10 and its associated lncRNA after AW treatment (a) Expression pattern of DE-NATs and their host genes after AW treatment. FC, fold change. (b) Expression pattern of DE incRNAs and their host genes after AW treatment. (c) Schematic diagram of JAZ10 and its natural antisense transcripts. Mean transcript abundance (± SE, n = 5) of JAZ10 (d) and NAT-JAZ10 (e) in AW-treated and control leaves. Transcript levels were analyzed by reverse transcription-quantitative PCR (RT-qPCR). The primers used for RT-qPCR are listed in the Supplemental Material. Asterisks indicate significant differences in the treated plants relative to the control plants (**, p < .01; Student’s t-test). (f) KEGG enrichment analysis of DE genes neighboring DE lincRNAs. GeneRatio, ratio of gene numbers in a particular term to all gene numbers. The size of each circle represents the protein numbers of the pathways. The color density indicates the significance of the pathway enrichment (p < .05)
