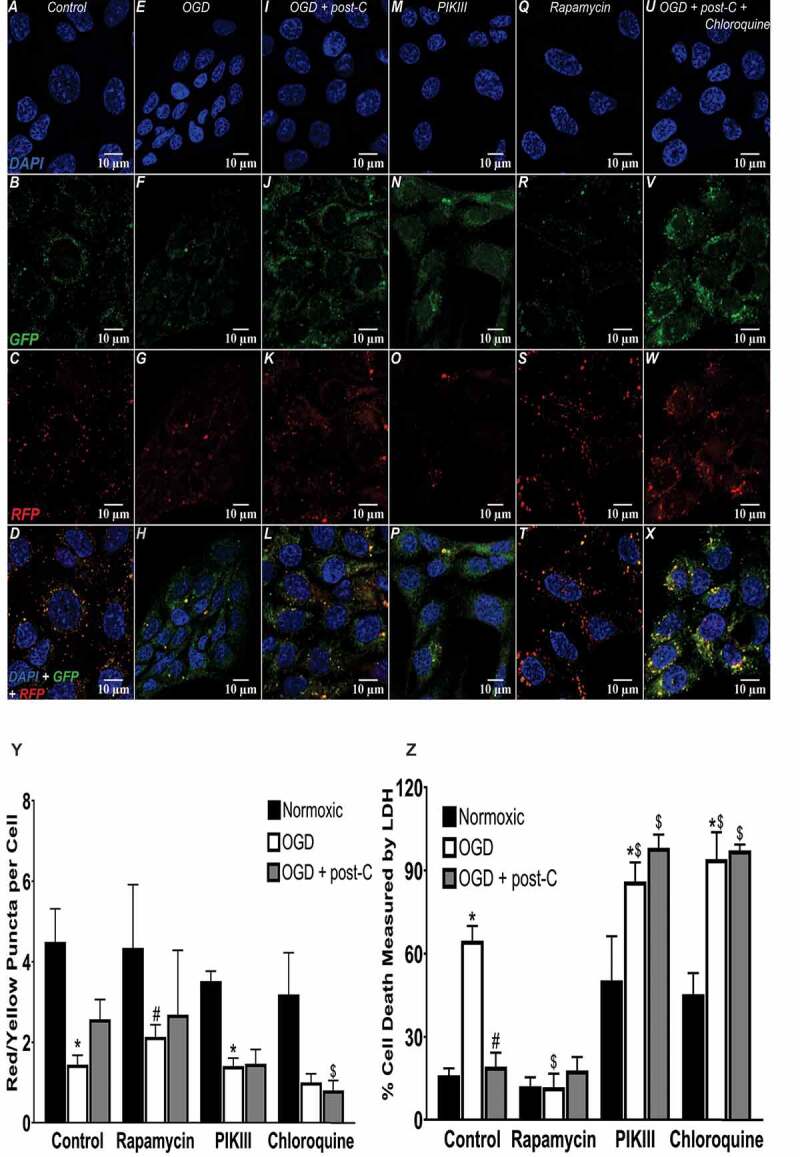
Figure 12.

Autophagic flux, stimulants, and antagonists in simulated ischemia in vitro. (A-X) Representative immunofluorescence images comparing autophagic flux in R28 cells subjected to OGD + post-C using tandem RFP-GFP-LC3 reagent, PIK-III and chloroquine as negative control autophagy inhibitors, and rapamycin to stimulate autophagy, as a positive control. In each experiment, top to bottom are DAPI, GFP, RFP, and merged, all displayed at 63x. (Y) Quantitation of flux (red/yellow puncta per cell): mean ± SEM; N = 4. * = P < 0.05 vs normoxia; # = p < 0.05 vs. control OGD; $ = p < 0.05 vs. control OGD + post-C. mean ± SEM; N = 6. * = p < 0.05 normoxia vs. OGD within groups. # = p < 0.05 for OGD alone vs. OGD + post-C, $ = p < 0.05 for matched groups vs. control (far-left bars of each set)
