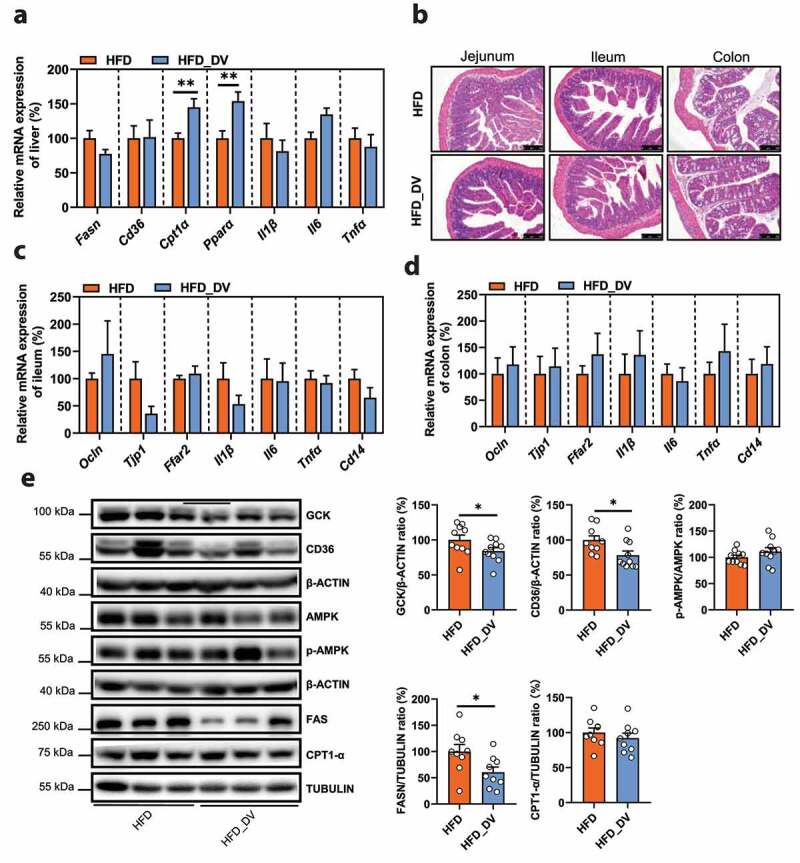
Figure 7.

(a) The relative mRNA expression of genes for lipid metabolism (Fasn, Cd36, Cpt1α, Ppar-α) and pro-inflammatory cytokines (Il1β, Il6, Tnfα) in liver tissues (%, n = 10). (b) Representative photomicrographs of jejunum, ileum, and colon tissues with H&E staining (magnification × 200, 50 μm). (c) The relative mRNA expression of genes for intestinal integrity (Ocln, Tjp1), SCFAs receptor (Ffar2), and inflammation (Il1β, Il6, Tnfα, Cd14) in ileum tissues (%, n = 6). (d) The relative mRNA expression of genes for intestinal integrity (Ocln, Tjp1), SCFAs receptor (Ffar2), and inflammation (Il1β, Il6, Tnfα, Cd14) in colon tissues (%, n = 6). (e) The protein expression of GCK, CD36, p-AMPK/AMPK, FASN, and CPT1-α in liver tissues (%, n = 9–10). Data are presented as the mean ± s.e.m.; *p < .05, **p < .01
