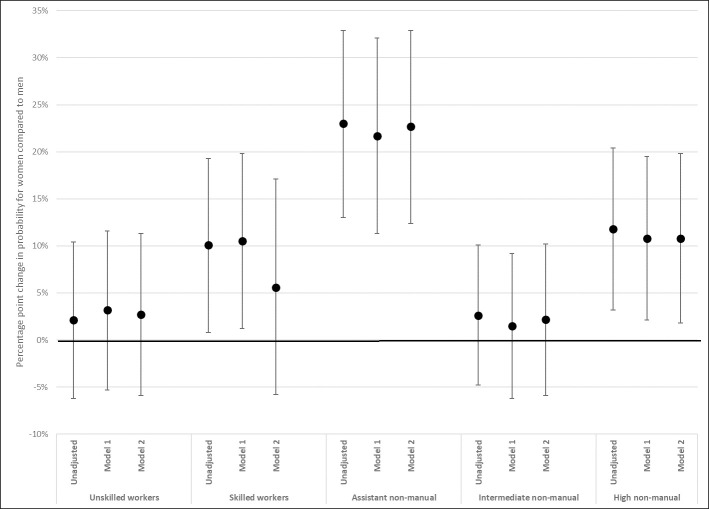
Fig 6. Gender differences in probability of musculoskeletal pain, by class.
Coefficients from class-separate LPM. Coefficients (for woman = 1) interpreted as percentage point change in probability for musculoskeletal pain. From class-separate linear probability models, with 95% confidence intervals (Table G in S4 Appendix). Unadjusted model regresses musculoskeletal pain on gender, separately by class. Stepwise adjustment for physical working conditions (Model 1) and psychosocial working conditions (Model 2). Both unadjusted and adjusted models are controlled for age and age^2.

