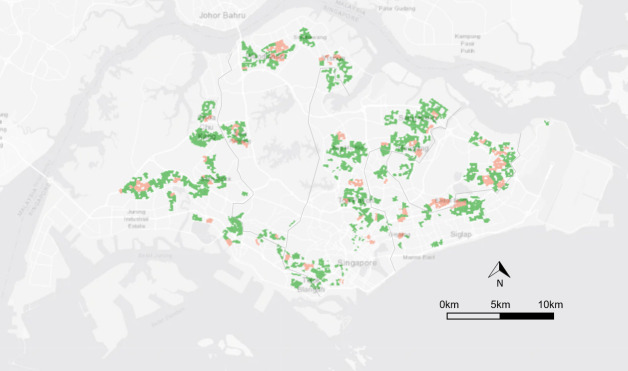
Fig 4. Map showing the spatial distribution of the cases (red) and controls (green).
The grey boundary lines indicate the five geographical districts in Singapore. The figure was created using R software with base layer obtained from https://landsatlook.usgs.gov/.

