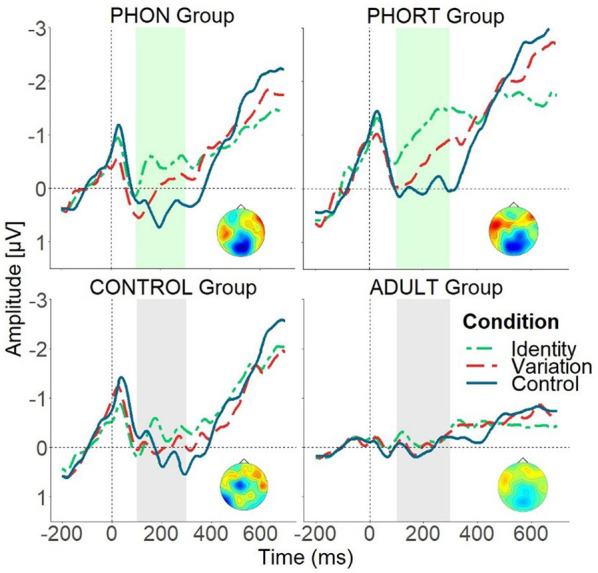
Figure 2.

Mean ERP effects over both anterior regions for all four groups separately, illustrating significant ERP differences between groups (see interaction effects including the factor GROUP in the time window between 100 and 300 ms after target word onset). Upper panels: the phonemic-only group (PHON, left) and the phonemic-orthographic training group (PHORT, right). Lower panels: control training group (CONTROL, left) and adult control group (ADULT, right). Identity condition (green, short-dashed line), Variation condition (red, long-dashed line) and Control condition (blue, solid line). The light gray bar marks the analysis area for time window 100–300 ms in which significant group differences were found. The depicted topographical voltage maps indicate significant difference waves for the Variation condition minus Identity condition for the three training groups.
