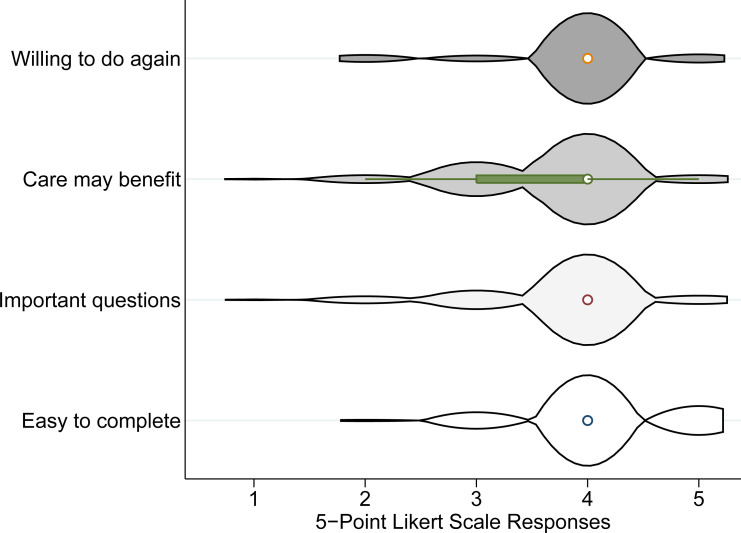
Fig 1. Violin plots of answers to acceptability questions scored on 5-point Likert scales.
Violin plots are modified box plots that add estimated kernel density plots to the summary statistics displayed by box plots. The 5-point Likert scales ranged from 1 = very unwilling/strongly disagree/very hard to 5 = very willing/strongly agree/very easy.

