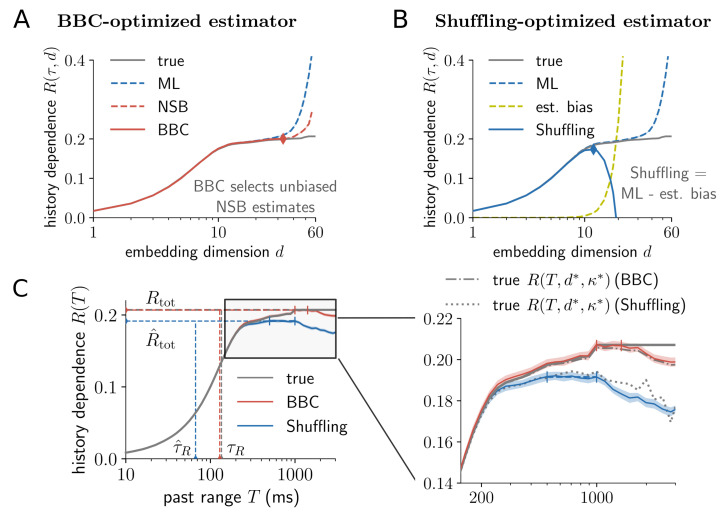
Fig 5. Embedding optimization captures history dependence for a neuron model with long-lasting spike adaptation.
Results are shown for a generalized leaky integrate-and-fire (GLIF) model with long-lasting spike frequency adaptation [3, 43] with a temporal depth of one second (Methods and material). (A) For illustration, history dependence R(τ, d) was estimated on a simulated 90 minute recording for different embedding dimensions d and a fixed bin width τ = 20 ms. Maximum likelihood (ML) [28] and Bayesian (NSB) [33] estimators display the insufficient embedding versus estimation bias trade-off: For small embedding dimensions d, the estimated history dependence is much smaller, but agrees well with the true history dependence R(τ, d) for the given embedding. For larger d, the estimated history dependence increases, but when d is too high (d > 20), it severely overestimates the true R(τ, d). The Bayesian bias criterion (BBC) selects NSB estimates for which the difference between ML and NSB estimate is small (red solid line). All selected estimates are unbiased and agree well with the true R(τ, d) (grey line). Embedding optimization selects the highest, yet unbiased estimate (red diamond). (B) The Shuffling estimator (blue solid line) subtracts estimation bias on surrogate data (yellow dashed line) from the ML estimator (blue dashed line). Since the surrogate bias is higher than the systematic overestimation in the ML estimator (difference between grey and blue dashed lines), the Shuffling estimator is a lower bound to R(τ, d). Embedding optimization selects the highest estimate, which is still a lower bound (blue diamond). For A and B, shaded areas indicate ± two standard deviations obtained from 50 repeated simulations, which are very small and thus hardly visible. (C) Embedding-optimized BBC estimates (red line) yield accurate estimates of the model neuron’s true history dependence R(T), total history dependence Rtot and information timescale τR (horizontal and vertical dashed lines). The zoom-in (right panel) shows robustness of both regularization methods: For all T the model neuron’s R(T, d*, κ*) lies within errorbars (BBC), or consistently above the Shuffling estimator that provides a lower bound. Here, the model’s R(T, d*, κ*) was computed for the optimized embedding parameters d*, κ* that were selected via BBC or Shuffling, respectively (dashed lines). Shaded areas indicate ± two standard deviations obtained by bootstrapping, and colored vertical bars indicate past ranges over which estimates were averaged to compute (Materials and methods).

