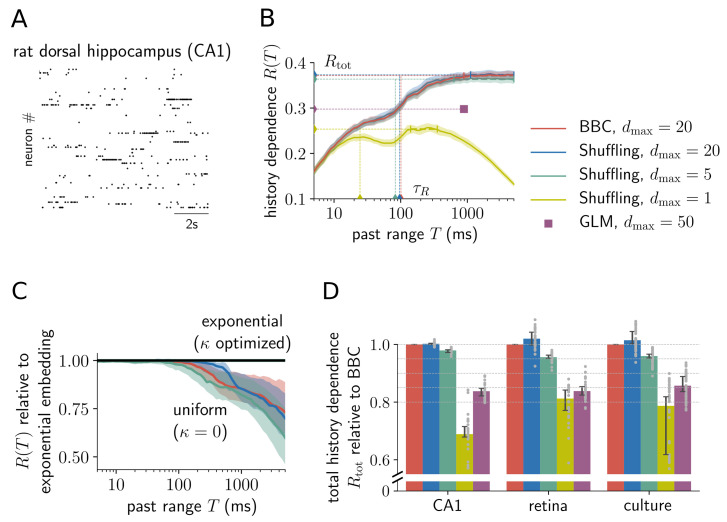
Fig 6. Embedding optimization is key to estimate long-lasting history dependence in extra-cellular spike recordings.
(A) Example of recorded spiking activity in rat dorsal hippocampus layer CA1. (B) Estimates of history dependence R(T) for various estimators, as well as estimates of the total history dependence Rtot and information timescale τR (dashed lines) (example single unit from CA1). Embedding optimization with BBC (red) and Shuffling (blue) for dmax = 20 yields consistent estimates. Embedding-optimized Shuffling estimates with a maximum of dmax = 5 past bins (green) are very similar to estimates obtained with dmax = 20 (blue). In contrast, using a single past bin (dmax = 1, yellow), or fitting a GLM for the temporal depth found with BBC (violet dot), estimates much lower total history dependence. Shaded areas indicate ± two standard deviations obtained by bootstrapping, and small vertical bars indicate past ranges over which estimates of R(T) were averaged to estimate Rtot (Materials and methods). (C) An exponential past embedding is crucial to capture history dependence for high past ranges T. For T > 100 ms, uniform embeddings strongly underestimate history dependence. Shown is the median of embedding-optimized estimates of R(T) with uniform embeddings, relative to estimates obtained by optimizing exponential embeddings, for BBC with dmax = 20 (red) and Shuffling with dmax = 20 (blue) and dmax = 5 (green). Shaded areas show 95% percentiles. Median and percentiles were computed over analyzed sorted units in CA1 (n = 28). (D) Comparison of total history dependence Rtot for different estimation and embedding techniques for three different experimental recordings. For each sorted unit (grey dots), estimates are plotted relative to embedding-optimized estimates for BBC and dmax = 20. Embedding optimization with Shuffling and dmax = 20 yields consistent but slightly higher estimates than BBC. Strikingly, Shuffling estimates for as little as dmax = 5 past bins (green) capture more than 95% of the estimates for dmax = 20 (BBC). In contrast, estimates obtained by optimizing a single past bin, or fitting a GLM, are considerably lower. Bars indicate the median and lines indicate 95% bootstrap confidence intervals on the median over analyzed sorted units (CA1: n = 28; retina: n = 111; culture: n = 48).

