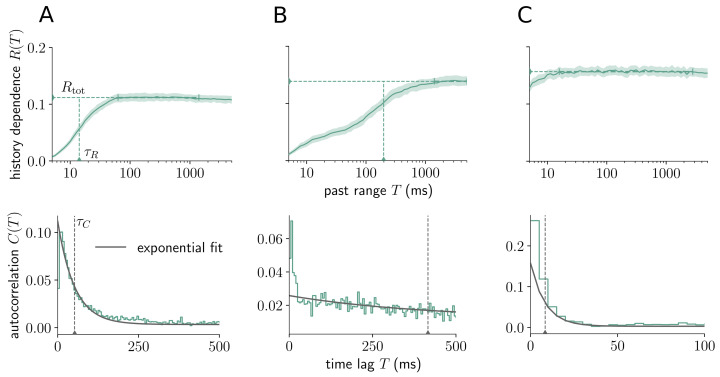
Fig 8. Distinct signatures of history dependence for different sorted units within mouse primary visual cortex.
(Top) Embedding-optimized estimates of R(T) reveal distinct signatures of history dependence for three different sorted units (A,B,C) within a single neural system (mouse primary visual cortex). In particular, sorted units have similar total history dependence Rtot, but differ vastly in the information timescale τR (horizontal and vertical dashed lines). Note that for unit C, τR is smaller than 5 ms and thus doesn’t appear in the plot. Shaded areas indicate ± two standard deviations obtained by bootstrapping, and vertical bars indicate the interval over which estimates of R(T) were averaged to estimate Rtot (Materials and methods). Estimates were computed with the Shuffling estimator and dmax = 5. (Bottom) Autocorrelograms for the same sorted units (A,B, and C, respectively) roughly show an exponential decay, which was fitted (solid grey line) to estimate the autocorrelation time τC (grey dashed line). Similar to the information timescale τR, only coefficients for T larger than T0 = 10 ms were considered during fitting.

