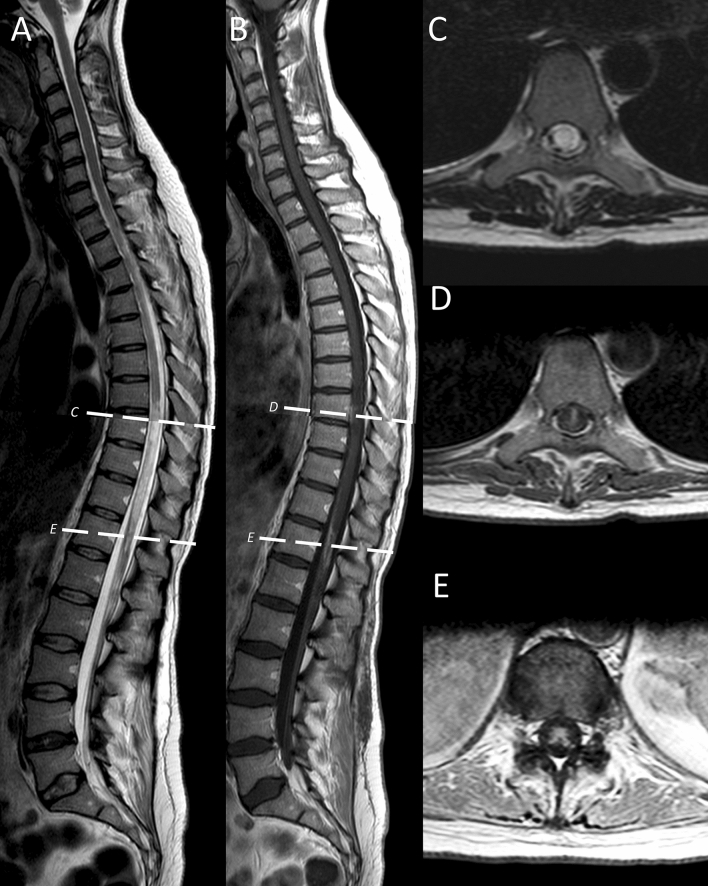
Fig. 3.
Two months after subacute onset follow-up spinal MRI (no steroid therapy) shows severe chronic LETM with still some active inflammation at the same sites. From left to right: compared to the images at subacute onset (Fig. 2; with steroids) sagittal spinal MRI (1.5T, T2w) revealed much stronger and more extensive longitudinal T2w signal intensities (A) throughout the thoracic myelon from Th7 to the conus, and in (B) stronger enhancement in the conus and at TH8 in the T1w images with contrast. The transverse slices on the right show the corresponding slices at the level of TH8 and the conus indicated by the white hatched lines in the sagittal images. C Transverse T2w images; D, E transverse T1w images with contrast at the levels indicated in the sagittal slices

