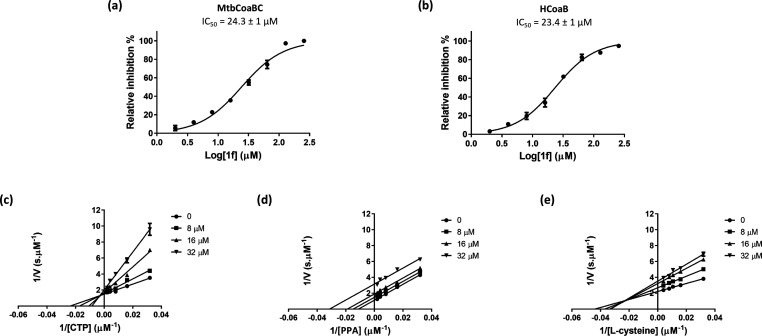
Figure 3.
CoaBC inhibition by compound 1f. Dose response profile for MtbCoaBC (a) and HCoaB (b). Lineweaver–Burk plots showing the effect of varying concentrations of compound 1f in the presence of varying concentrations of CTP (c), PPA (d), and l-cysteine (e). Data are representative of the mean and SD of independent triplicates.

