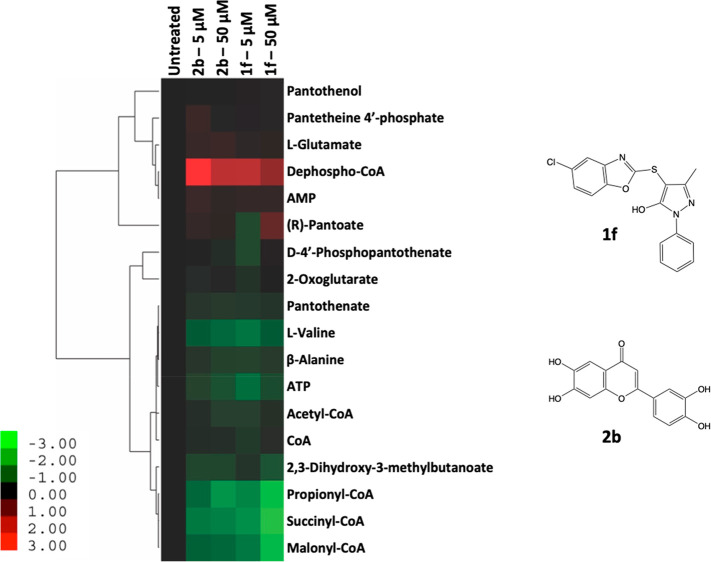
Figure 4.
Metabolic impact of exposure of wild-type Mtb H37RvMA to 1f and 2b at 5 μM and 50 μM. Relative metabolite abundances (based on ion intensities) are indicated in heat map format, where relative abundance refers to the change in the abundance of a given metabolite in the presence of varying concentrations of 1f and 2b as compared to an untreated (DMSO) control. Data are log2 transformed, with columns representing individual treatments, as indicated, and vertical clustering by rows revealing groups of metabolites exhibiting similar responses to drug exposure. Data are representative of independent triplicates and were parsed by uncentered Pearson’s correlation with centroid linkage clustering and rendered using the image generation program Java TreeView (http://jtreeview.sourceforge.net/).

