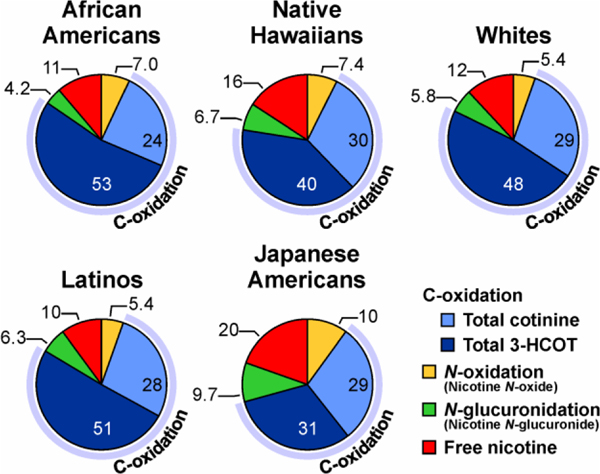
Figure 2.
Proportion of nicotine metabolized by C-oxidation, N-glucuronidation and N-oxidation in five ethnic/racial groups (n=2239 from a subset of the Multiethnic Cohort). The values are the molar percent of nicotine and six metabolites excreted in urine, and each slice of the pie is the mean percentage of the compound relative to TNE. From Murphy et al, Carcinogenesis (2014) 35 (11): 2526–2533. Used by permission of Oxford University Press.

