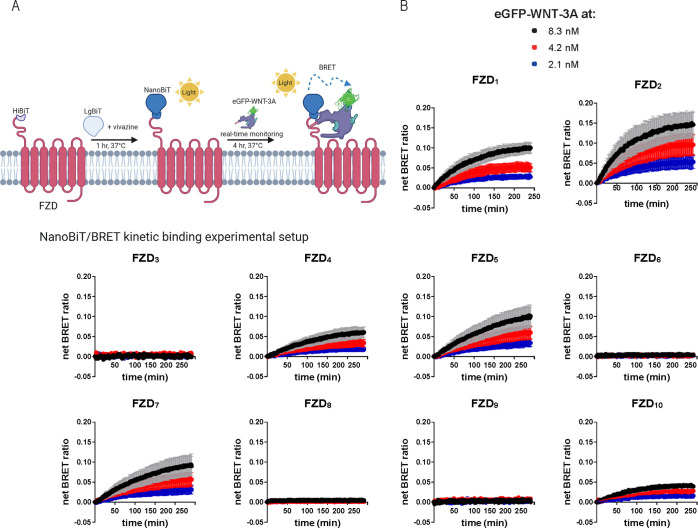
Figure 1.
eGFP-WNT-3A binding kinetics. A. The scheme depicts the experimental setup of the NanoBiT/BRET analysis of association kinetics between the HiBiT-tagged FZD and the eGFP-WNT-3A. Created with BioRender.com. B. Association kinetics of the eGFP-WNT-3A to human HiBiT-FZDs were determined by the detection of NanoBiT/BRET in transiently overexpressing living HEK293A cells over time. BRET was sampled once per 90 s for 240 min. Data points are presented as means ± SEM from n = 3 individual experiments, fitting a two or more hot ligand concentrations kinetics model. Experiments were performed with eGFP-WNT-3A batch 1.

