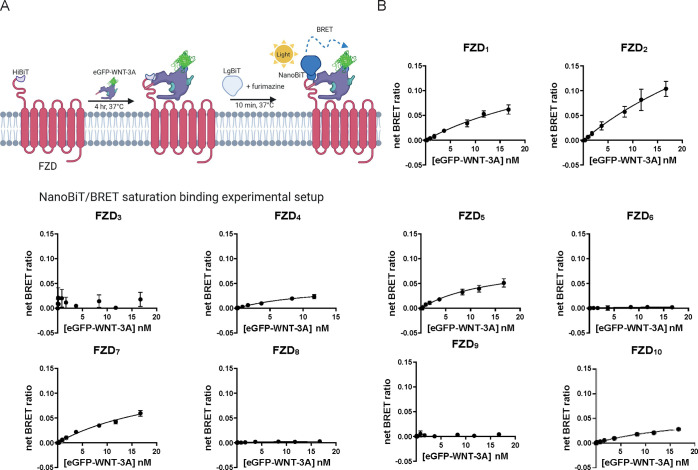
Figure 2.
eGFP-WNT-3A saturation binding. A. The scheme depicts the experimental setup of NanoBiT/BRET analysis of equilibrium binding between the HiBiT-tagged FZD and the eGFP-WNT-3A. Created with BioRender.com. B. Saturation binding of the eGFP-WNT-3A to human HiBiT-FZDs was determined by the detection of NanoBiT/BRET in transiently overexpressing living HEK293A cells following 240 min incubation. Data points are presented as means ± SEM from n = 4 individual experiments, fitting a one-site specific model models. Experiments were performed with eGFP-WNT-3A batch 1.

