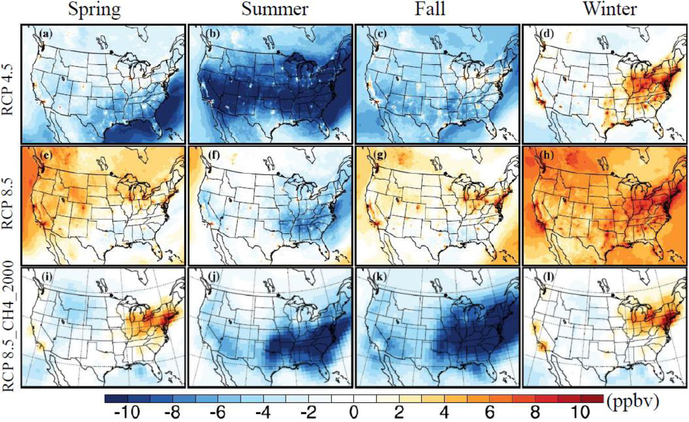
Fig. 5.
Seasonal mean surface ozone changes from CMAQ outputs under future climate (2057–2059 minus 2001–2004) for RCP 4.5 (a–d) and RCP 8.5 (e–h); the bottom panel (i–l) shows ozone changes from CAM-Chem by the end of the 2050s without methane increases in RCP 8.5 (ozone in the 2050s with 2000s methane concentrations – ozone in 2000s).

