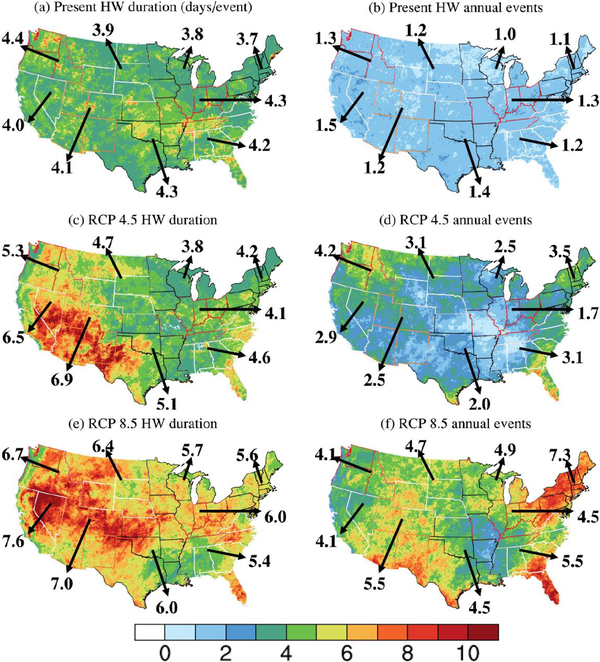
Fig. 7.
The heat wave duration and frequency derived from the daily maximum temperature simulated by WRF 3.2.1. The state boundary was labeled with different colors to distinguish different regions as shown in Fig. 1. The numbers next to the arrows represent the regional mean heat wave duration or frequency.

