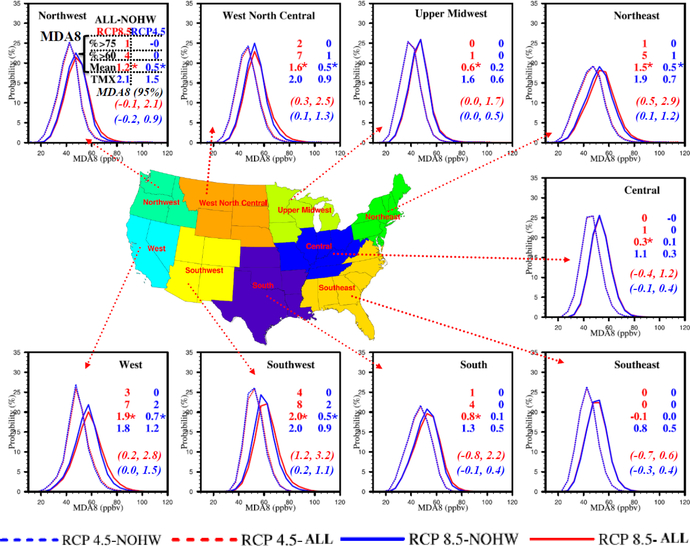
Fig. 8.
Distributions of MDA8 during the entire period (referred to as ALL) and non-heat wave period (referred to as NOHW) for RCP 4.5 and RCP 8.5 from June to October. There are two columns of numbers (top four rows), and they represent the percentage of MDA8 ozone exceeding 70 ppbv (top row) and 60 ppbv (second row), mean MDA8 ozone (third row, with unit of ppbv) and mean daily maximum temperature (TMX, fourth row, with unit of °C) for both scenarios. The bottom two row numbers in italics in parentheses represent the 95% confidence interval of MDA8 differences (ppbv) between the entire period and non-heat wave period under RCP 8.5 (red numbers) and RCP 4.5 (blue numbers). Statistical significance was tested and marked with a star to indicate statistical significant at the level of 0.05. All TMX mean differences are statistically significant.

