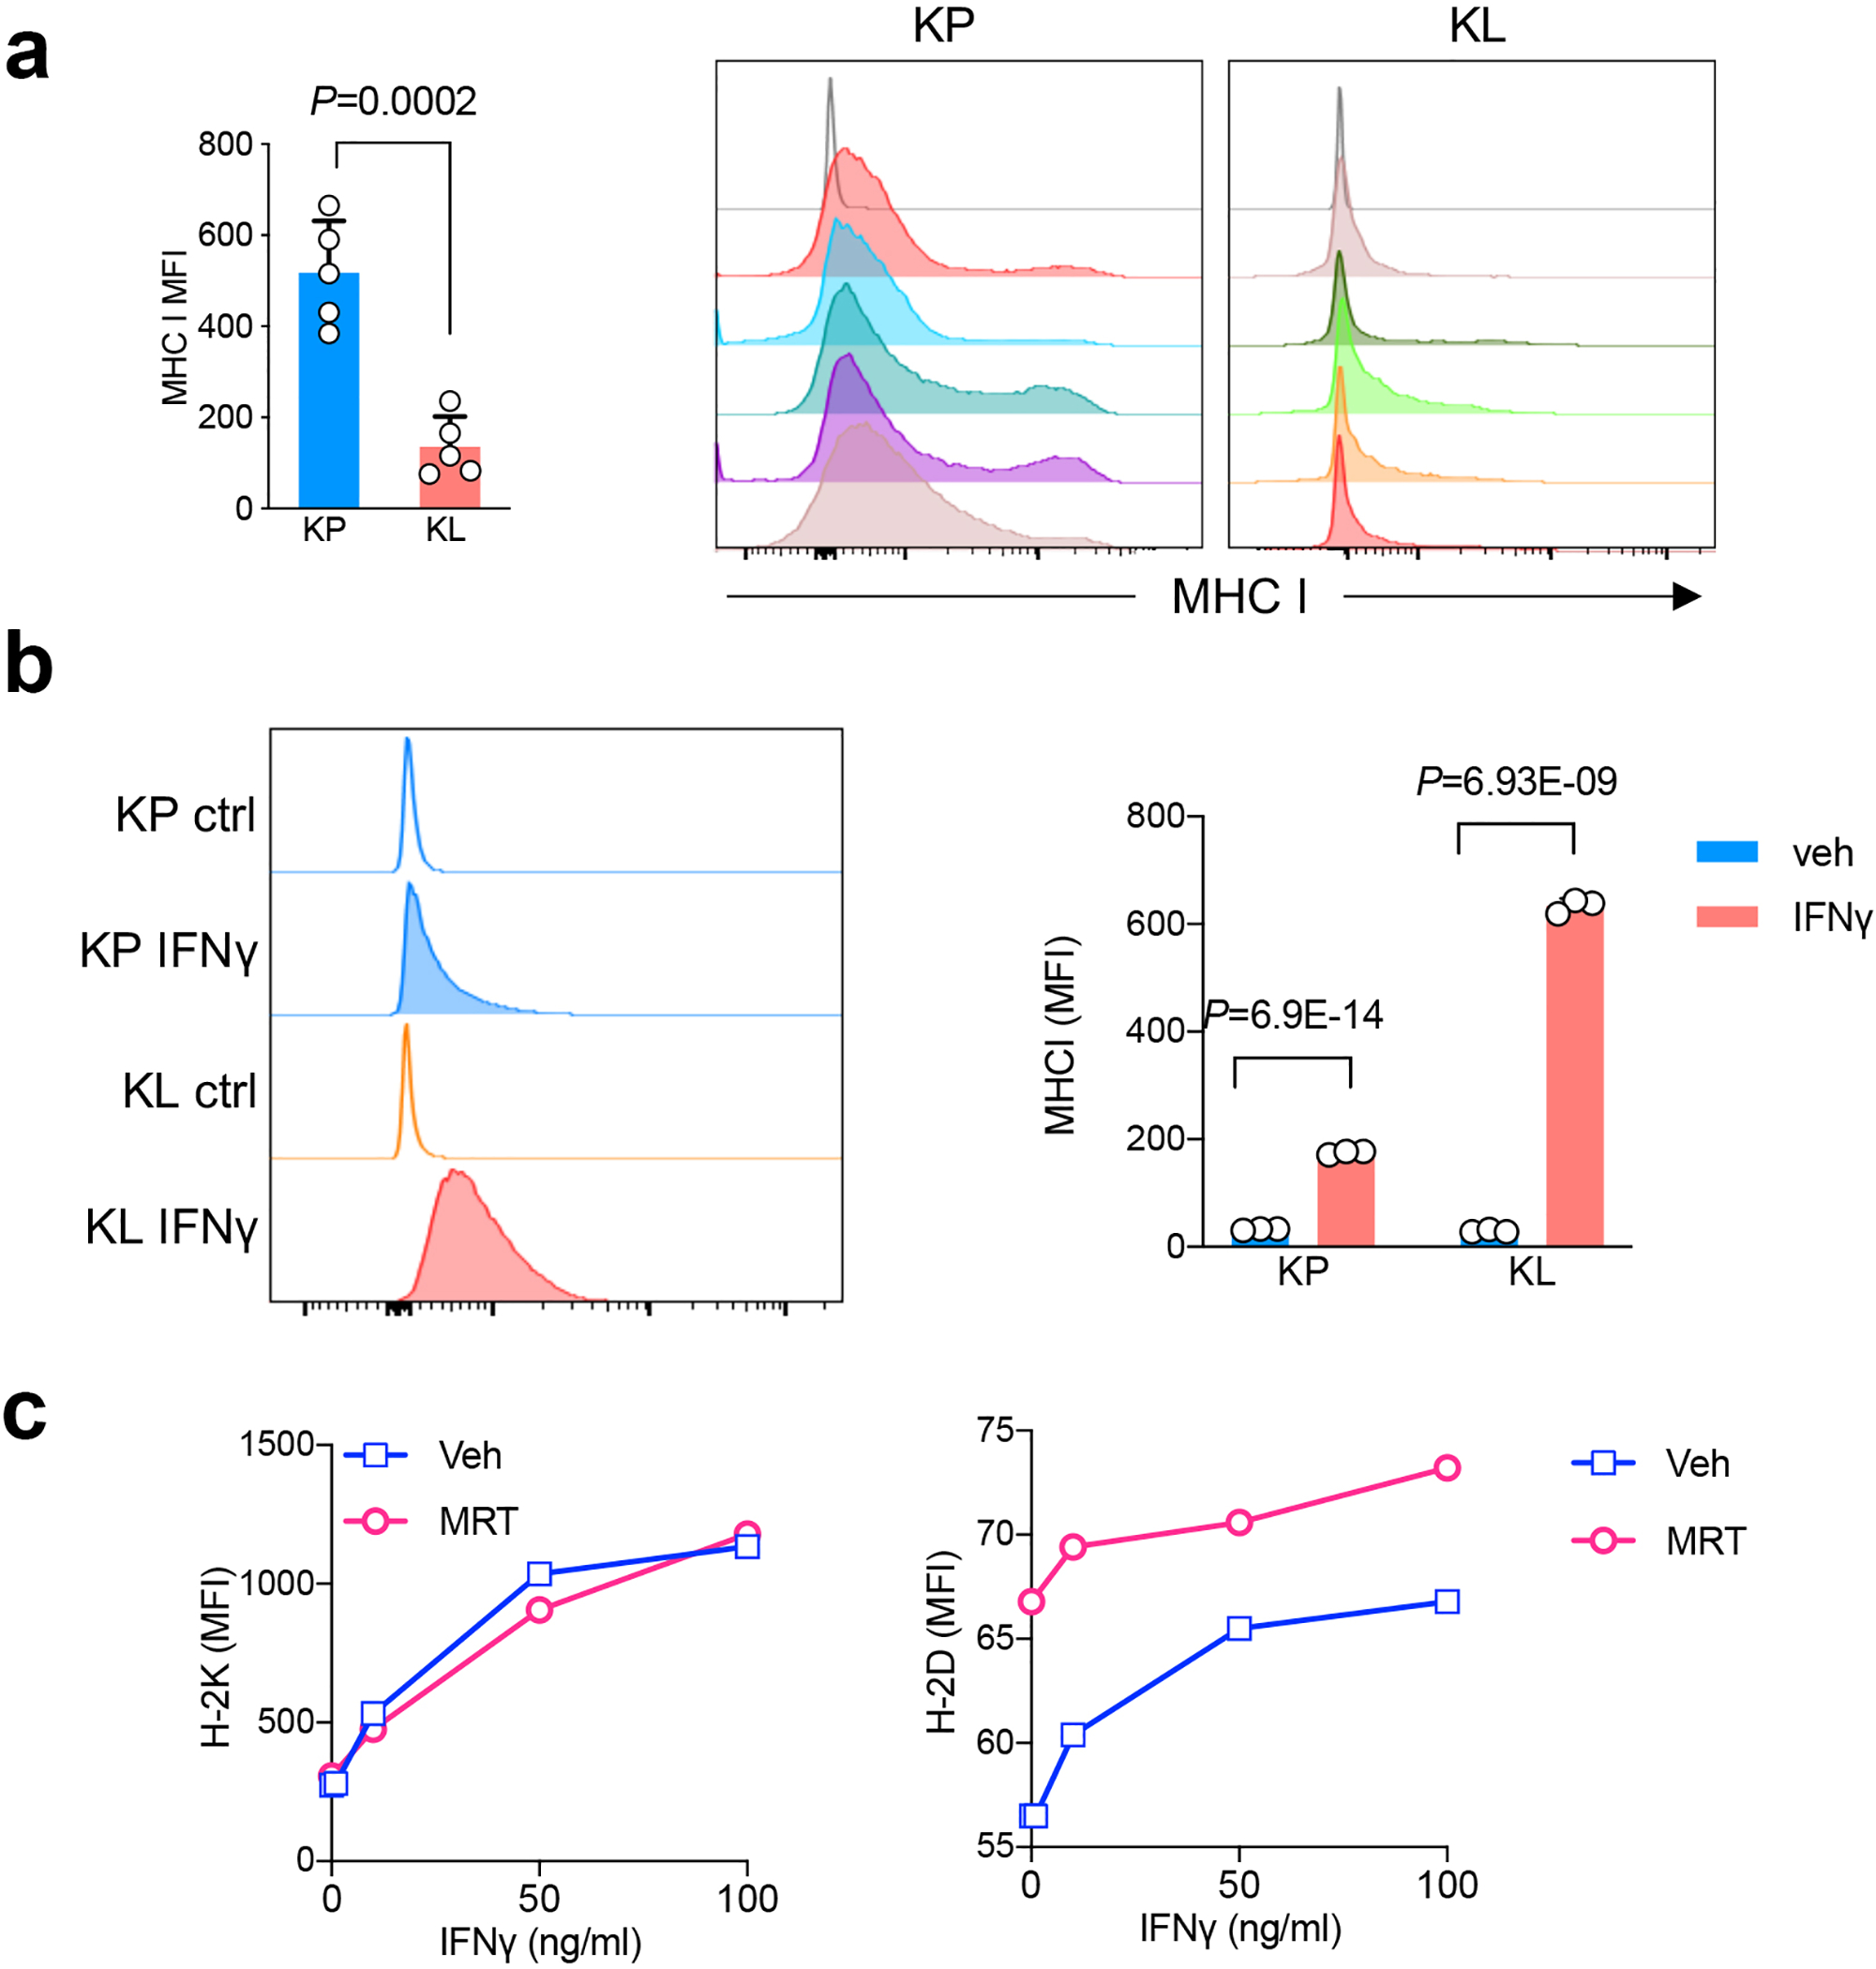
Extended Data Fig. 5|. MHCI levels in KL and KP tumors.

a. MHCI levels from KP or KL allograft tumors as quantified as median fluorescent intensity (MFI) (left). Right, representative histograms depict MHCI level from mice with KP and KL tumors. n=5 tumors each group. (mean±sd, two-sided t test, unpaired) b. MHC I levels from KP or KL tumor cell lines stimulated with IFNγ as shown MFI levels. Left panel, representative histograms. Right panel, quantification of MHC I expression levels in KP and KL after IFNγ (100ng/ml) stimulation for 18 hrs. n=3 cell cultures each group. Shown representative result of three independent experiments (mean±sd, multiple t test, FDR<0.05). c. MHC I subunit H-2K and H-2D levels change in response to ULK1 inhibitor MRT68921 in mouse KL line in vitro 48hrs after the treatment. Data representative of two independent experiments.
