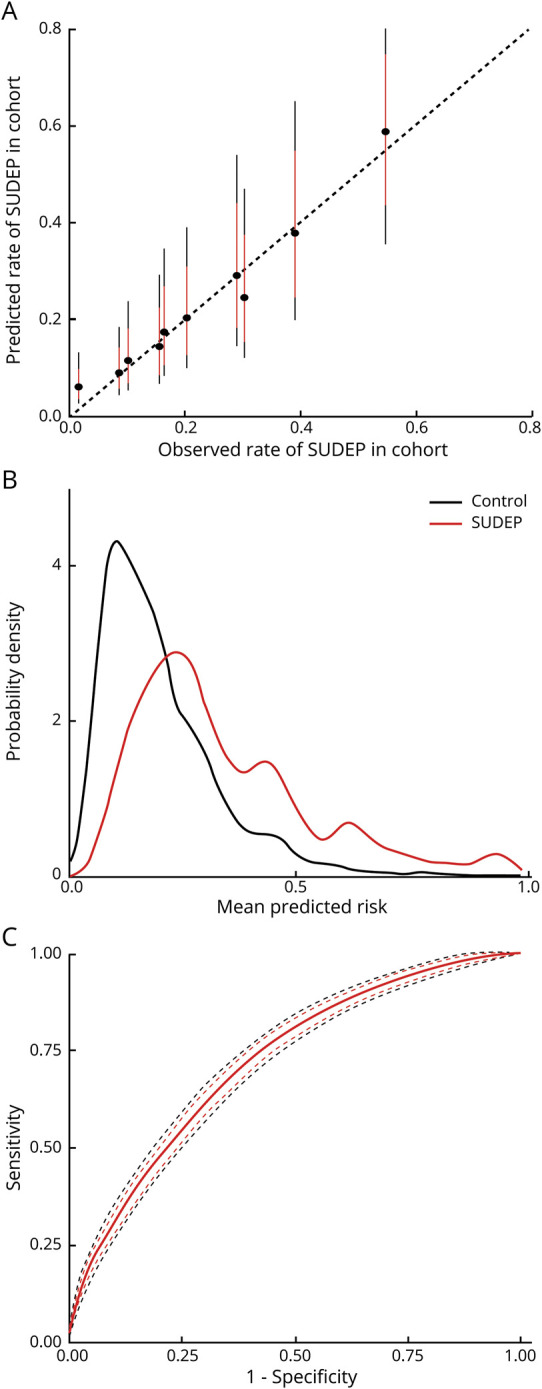
Figure 1. Internal Evaluation of Sudden Unexpected Death In Epilepsy (SUDEP) Model Performance.

(A) Calibration plot, where the observed cases are sorted into deciles based on the predicted risk from the model. For each subsequent decile, the observed rate of SUDEP in the dataset is plotted against the model prediction (black circle = average, red line 80% credibility interval, black line 95% credibility interval). The model shows excellent calibration—perfect calibration would be aligned along the dotted line where both values are equal. (B) Predicted risk probability distribution functions for SUDEP cases (red) and controls (black). Perfect discrimination would be illustrated by complete separation of the 2 distributions along the x axis; chance discrimination would be illustrated by complete alignment. Discrimination is reasonable but there is still a degree of overlap, suggesting a remaining degree of uncertainty at risk estimates around 0.2–0.4. This is consistent with the receiver operating characteristic curve (C), which shows the specificity and sensitivity of predicting SUDEP in this dataset based on model output (red line = mean, red dash = 80% credibility interval, black dash = 95% credibility interval). The internal area under the receiver operating characteristic curve is 0.72 (95% credibility interval 0.71–0.74), which is reasonable.
