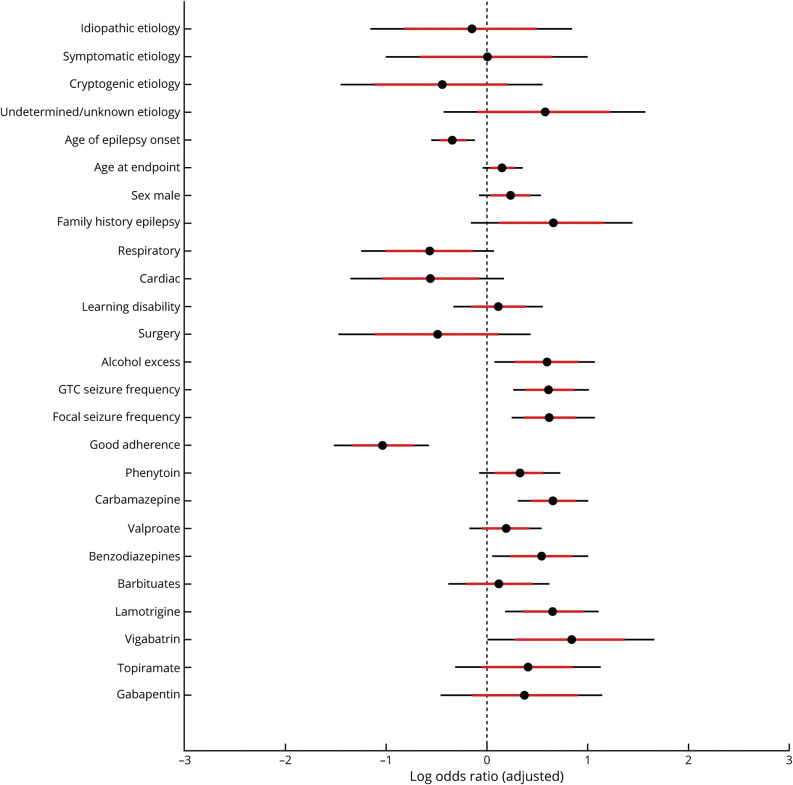
Figure 2. Adjusted Log Odds Ratios From Bayesian Logistic Regression Model.
Values less than 0 are associated with a reduced risk of sudden unexpected death in epilepsy (SUDEP) and values greater than 0 are associated with an increased risk of SUDEP, relative to the average population sample (black circle = average, red line 80% credibility interval, black line 95% credibility interval). See main text for interpretation, noting that the associations shown are not causal. GTC = generalized tonic-clonic.

