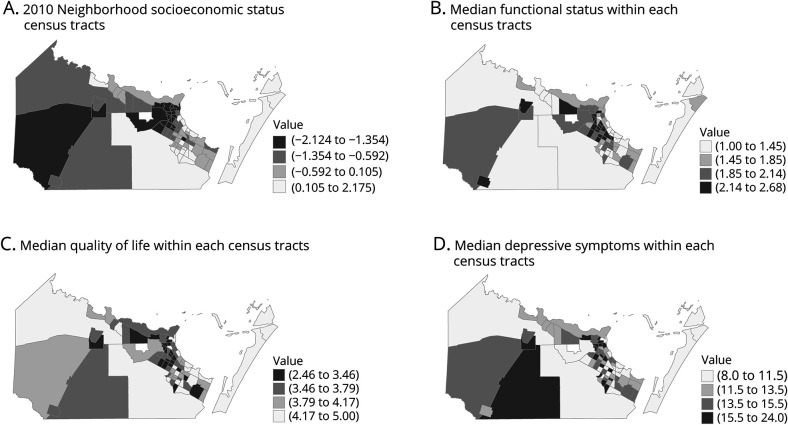
Figure 3. Maps of nSES and 90-Day Poststroke Outcomes Within 77 Census Tracts.
Maps of the 77 Census tracts were stroke cases reside in the Brain Attack Surveillance in Corpus Christi (BASIC) Project. (A) Relative neighborhood socioeconomic status (nSES) by quartile for each Census tract within the county of origin. (B–D) Median functional status, biopsychosocial health, and depressive symptoms by quartile. In all maps, lighter shading implies a better value: higher nSES, better poststroke functional status, better poststroke biopsychosocial health, and fewer depressive symptoms.

