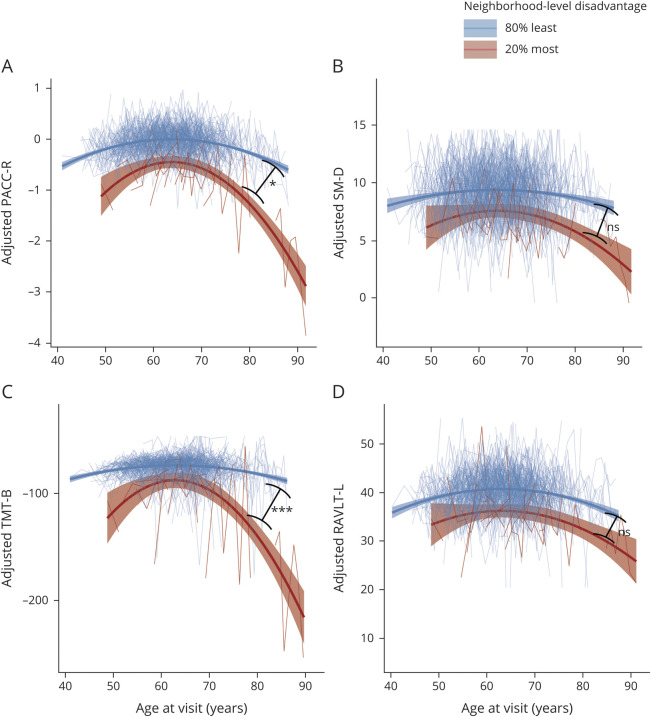
Figure 2. Association Between Neighborhood-Level Disadvantage and Longitudinal Cognitive Trajectories.
Plots depict performance on Preclinical Alzheimer's Cognitive Composite–Revised (PACC-R) composite (A) and component subtests (B–D) on the y-axis and age on the x-axis. Higher scores equate to better performance on cognitive test (Trail-Making Test, part B [TMT-B] scores are multiplied by −1 for graphical consistency). Cognitive test scores are adjusted for sex, years of education, practice effects, and individual-level intercepts and slopes. Small lines (spaghetti plot) depict individual trajectories; large lines depict estimated quadratic slopes for participants with the 80% least neighborhood-level disadvantage (blue lines, n = 582) and 20% most disadvantage (red lines, n = 19). Participants from the most highly disadvantaged neighborhoods exhibited significantly steeper decline in PACC-R and TMT-B than participants from less disadvantaged neighborhoods, but showed no difference in decline of Story Memory Delayed Recall (SM-D) or Rey Auditory Verbal Learning Test, total trials 1–5 (RAVLT-L). Unadjusted p values for age2:neighborhood disadvantage interaction terms are displayed on plots for each cognitive test: ns p > 0.05, *p < 0.05, ***p < 0.001.

