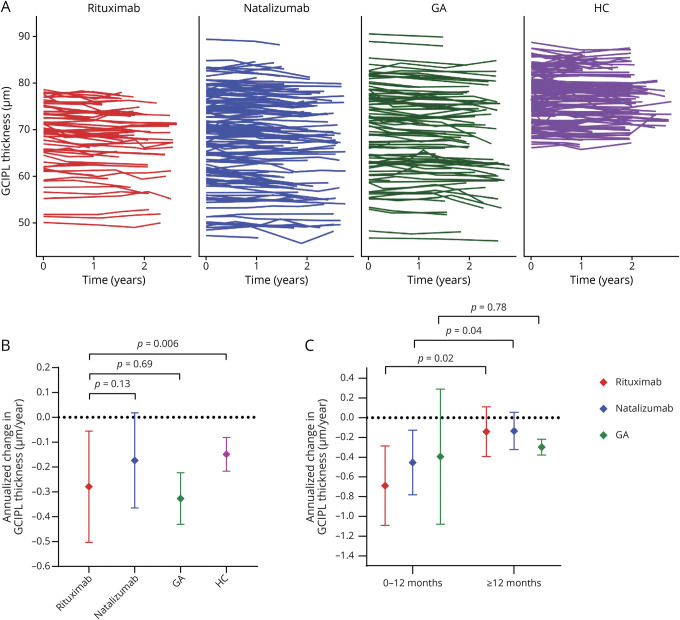
Figure 1. Ganglion Cell + Inner Plexiform Layer (GCIPL) Thickness Over Time, Stratified by Disease-Modifying Therapies (DMTs).
(A) Spaghetti plots depict the individual trajectory in GCIPL thickness stratified by DMT group. (B) Annualized change in GCIPL thickness (adjusted β, µm/y), stratified by DMTs, for the overall period of follow-up. The error bars represent the 95% confidence interval (CI) for the annualized change in GCIPL thickness. p Values derived from linear mixed-effects regression models accounting for within-subject intereye correlations, adjusting for age at baseline, sex, and race (White vs non-White) in comparisons between rituximab and healthy controls (HCs), and additionally for optic neuritis history, disease duration, and gap time in comparisons between DMTs. (C) Annualized change in GCIPL thickness (adjusted β, µm/y), stratified by DMTs, for the period pre vs post 12 months of treatment. The error bars represent the 95% CI for the annualized change in GCIPL thickness. p Values derived from linear mixed-effects regression models accounting for within-subject intereye correlations, adjusting for age at baseline, sex, race (White vs non-White), optic neuritis history, disease duration, and gap time. Figure was made using R version 3.61 (Vienna, Austria) and GraphPad Prism version 8.2 (GraphPad Software, La Jolla, CA; graphpad.com). GA = glatiramer acetate.

