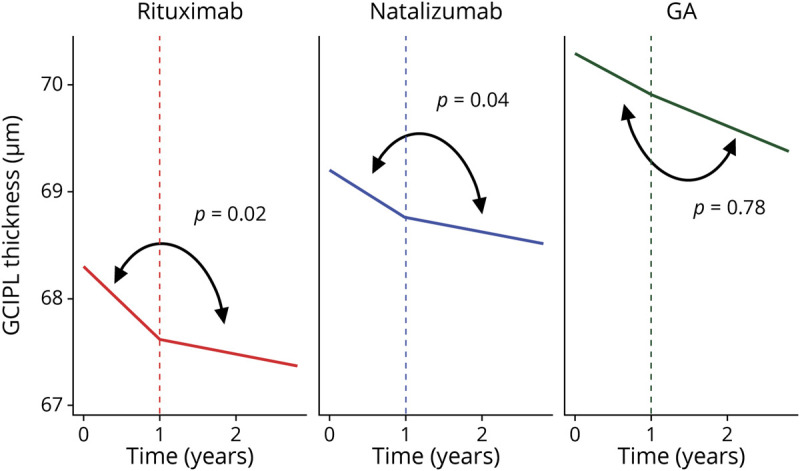
Figure 2. Difference in the Slope of Annualized Ganglion Cell + Inner Plexiform Layer (GCIPL) Thickness Over Time, Stratified by Disease-Modifying Therapies (DMTs), for the Period <12 Months vs ≥12 Months of Treatment.

Difference, µm/y (95% confidence interval): rituximab: 0.55 (0.10–0.99); natalizumab: 0.32 (0.02–0.62); glatiramer acetate (GA) 0.10 (−0.58 to 0.78). p Values derived from linear mixed-effects regression models accounting for within-subject intereye correlations, adjusting for age at baseline, sex, race (White vs non-White), optic neuritis history, and disease duration, which assess the difference in slope <12 months vs ≥12 months of treatment for each DMT. Figure was made using R version 3.61 (Vienna, Austria) and R version 3.61.
