. 2021 Jun 4;10:e69866. doi: 10.7554/eLife.69866

Figure 3. Correlation of mortality (death per admission) and COVID-19 convalescent plasma (CCP) doses per admitted patients using the Our World in Data (OWID) database.

Correlation analysis yields a Pearson’s correlation coefficient of −0.518 (p=0.0024). The black line represents a linear model regression with an R squared of 0.268.

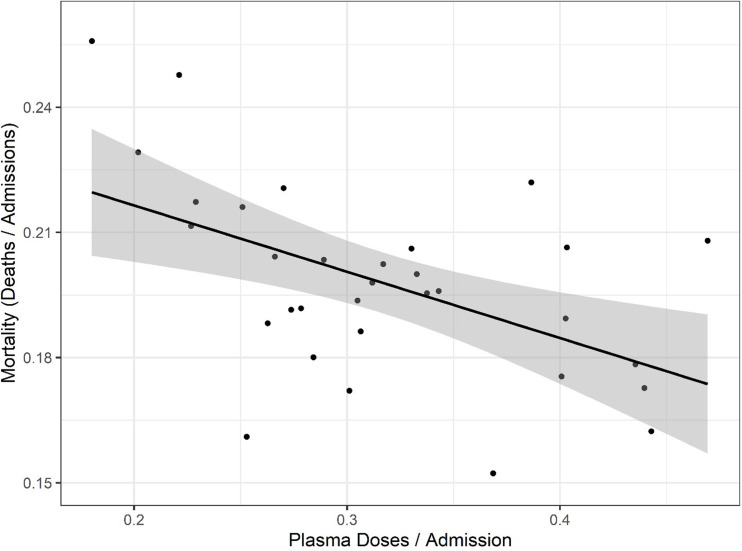
Figure 3—source data 1. Source data for Figure 3.

Figure 3.

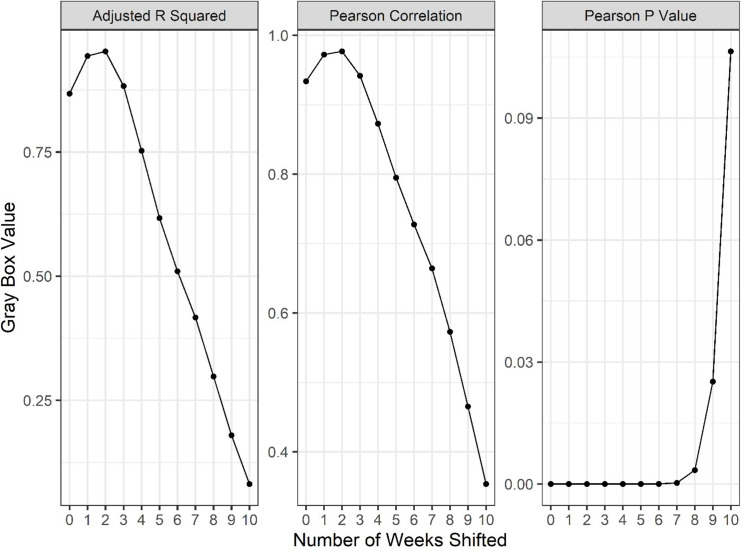
Figure 3—figure supplement 1. A series of linear regressions and Pearson’s correlation tests comparing weekly reported deaths to new weekly hospital admissions, offset by various numbers of weeks to identify the length of lag between admission and death of patients using Our World in Data (OWID) database.

Figure 3—figure supplement 1.

y-Axis values reflect the parameter of each gray box throughout the shifted weeks. Correlations peak at 2–3 weeks shifted, suggesting the lag time between admission and reported death is roughly 2 weeks.
Figure 3—figure supplement 1—source data 1. Source data for Figure 3—figure supplement 1 .
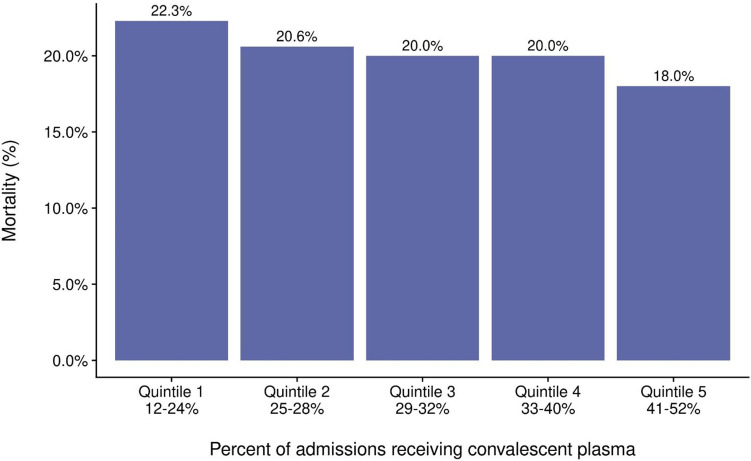
Figure 3—figure supplement 2. Mortality from COVID-19 by quintile of percent of admissions receiving COVID-19 convalescent plasma (CCP).

Figure 3—figure supplement 2.

Regression analysis for the quintiles revealed R = 0.5 and p=0.03.
Figure 3—figure supplement 2—source data 2. Source data for Figure 3—figure supplement 2.
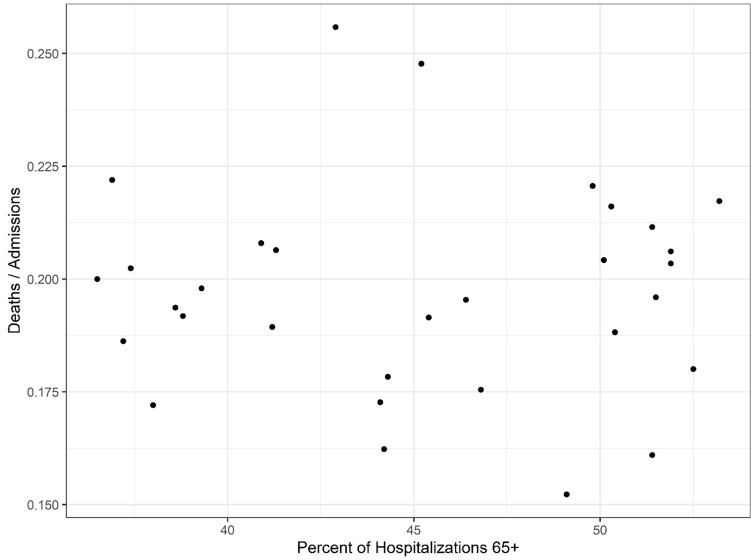
Figure 3—figure supplement 3. Investigation of high age group mortality.

Figure 3—figure supplement 3.

The shifted mortality is compared to the percent of hospitalized patients 65+ each week as reported by the Centers for Disease Control (CDC). There is no significant correlation between the two variables, suggesting changes in mortality are not explainable by an increase in hospitalized high-risk patients.
Figure 3—figure supplement 3—source data 3. Source data for Figure 3—figure supplement 3.