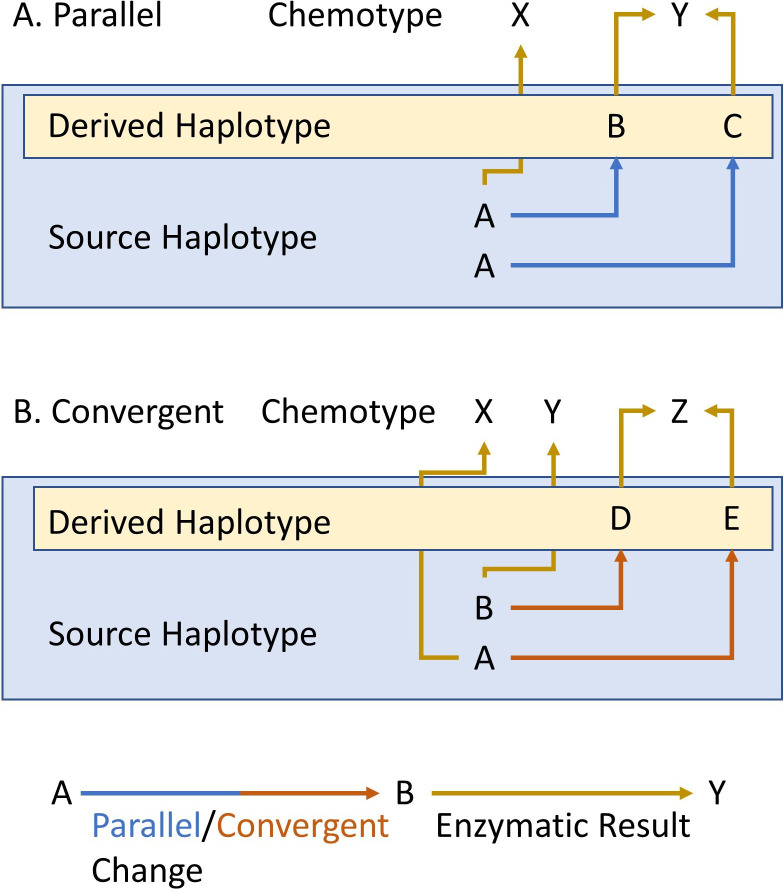
Figure 1. Parallel and convergent evolution.
The schema describes our use of parallel (A) and convergent (B) evolution for within-species chemotypic variation. The letters in the blue box represent the state of the source/ancestral haplotypes. The letters within the yellow box represent the newly derived haplotypes that arose by genetic mutation in the source haplotype. Finally, X, Y and Z show the chemotypes that arise from each haplotype. Blue and red arrows represent parallel or convergent genetic changes (respectively), while mustard arrows represent the enzymatic result.

