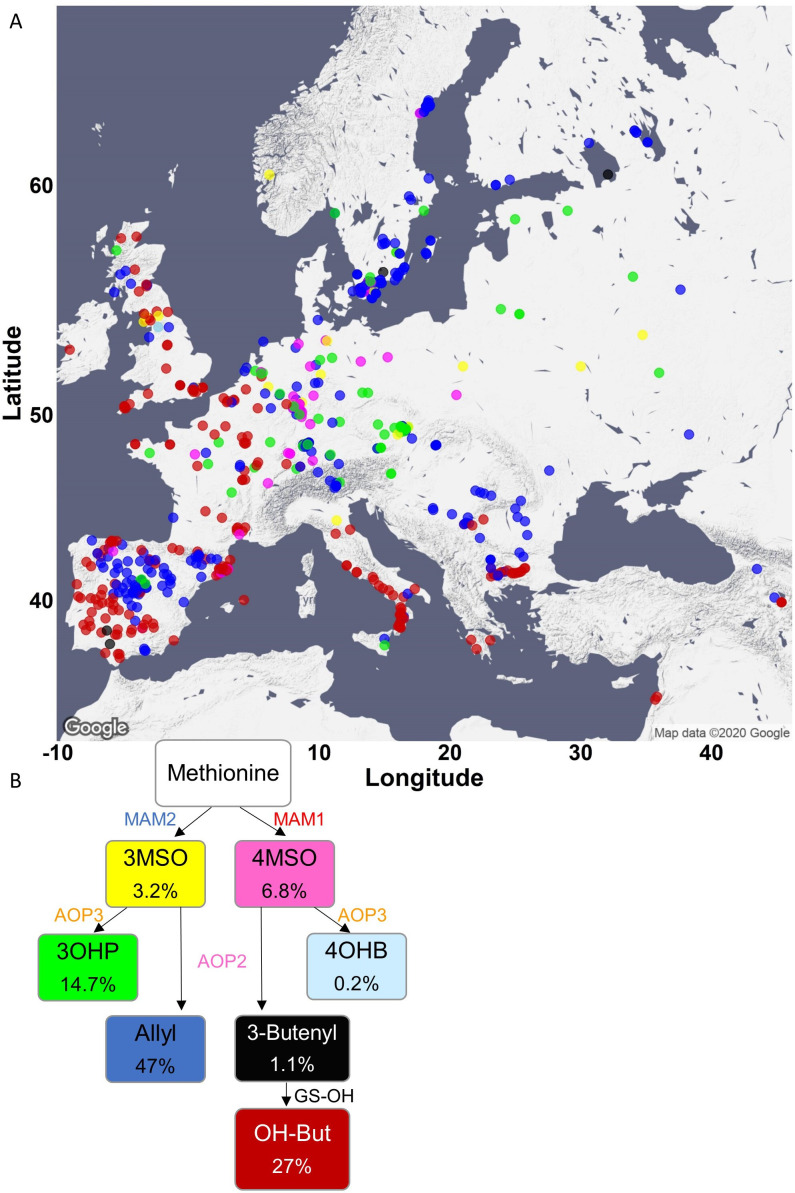
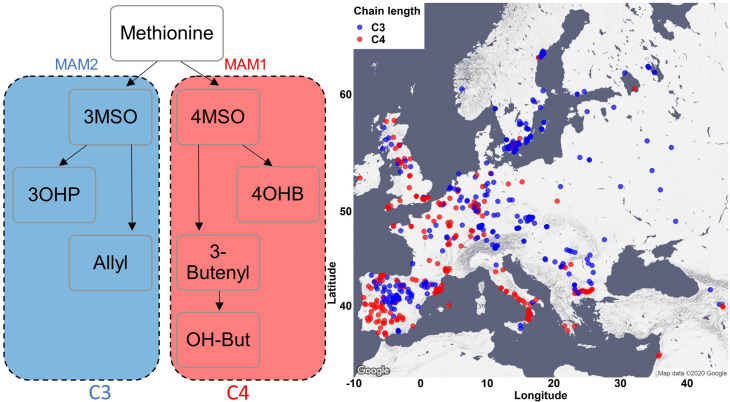
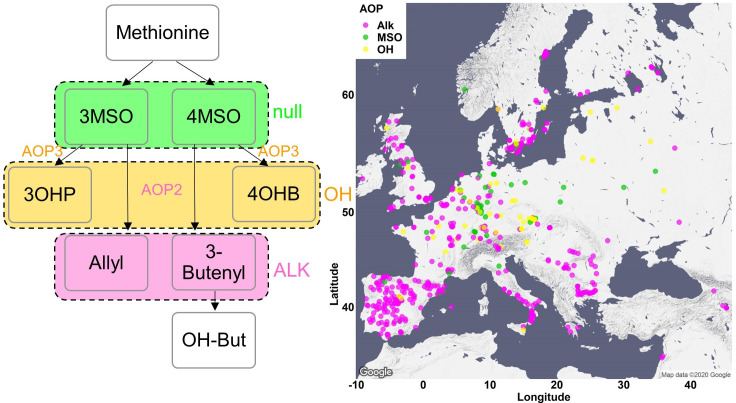
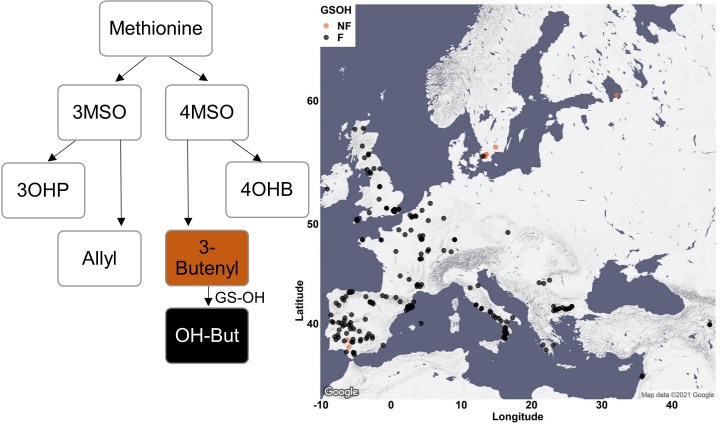
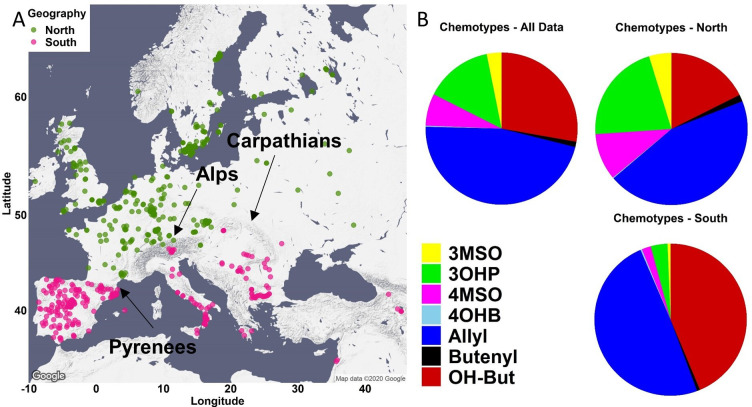
Figure 4. Phenotypic classification based on glucosinolate (GSL) content.
(A) Using the GSL accumulation, each accession was classified to one of seven aliphatic short-chained GSL chemotypes based on the enzyme functions as follows: MAM2, AOP null: classified as 3MSO dominant, colored in yellow. MAM1, AOP null: classified as 4MSO dominant, colored in pink. MAM2, AOP3: classified as 3OHP dominant, colored in green. MAM1, AOP3: classified as 4OHB dominant, colored in light blue. MAM2, AOP2: classified as Allyl dominant, colored in blue. MAM1, AOP2, GS-OH non-functional: classified as 3-Butenyl dominant, colored in black. MAM1, AOP2, GS-OH functional: classified as 2-OH-3-Butenyl dominant, colored in red. The accessions were plotted on a map based on their collection sites and colored based on their dominant chemotype. (B) The coloring scheme with functional GSL enzymes in the aliphatic GSL pathway is shown with the percentage of accessions in each chemotypes (out of the total 797 accessions) shown in each box.

