. 2021 May 5;10:e67784. doi: 10.7554/eLife.67784

Figure 5. MAM3 phylogeny.

(A) MAM3 phylogeny of Arabidopsis thaliana accessions, rooted by Arabidopsis lyrata MAMb, which is not shown because of distance. Tree tips are colored based on the accession chemotype. (B) The genomic structure of the GS-Elong regions in the previously sequenced accessions is shown based on Kroymann et al., 2003. The structures in the box are based on sequences obtained in this work. The numbers left to the structures indicate the number of sequenced accessions in this work (left) or by Kroymann et al., 2003 (right). The numbers are colored based on their clades. Bright gray arrows represent MAM1 sequences, and dashed arrows represent MAM2 sequences. Dark gray arrows represent MAM3 sequences. The number to the right of the genomic cartoon represents the number of carbons in the side chain. (C) Collection sites of the accessions colored by their clade classification (from section A) and shaped based on the side chain length of the aliphatic short-chained glucosinolates (circles for C3, triangles for C4).

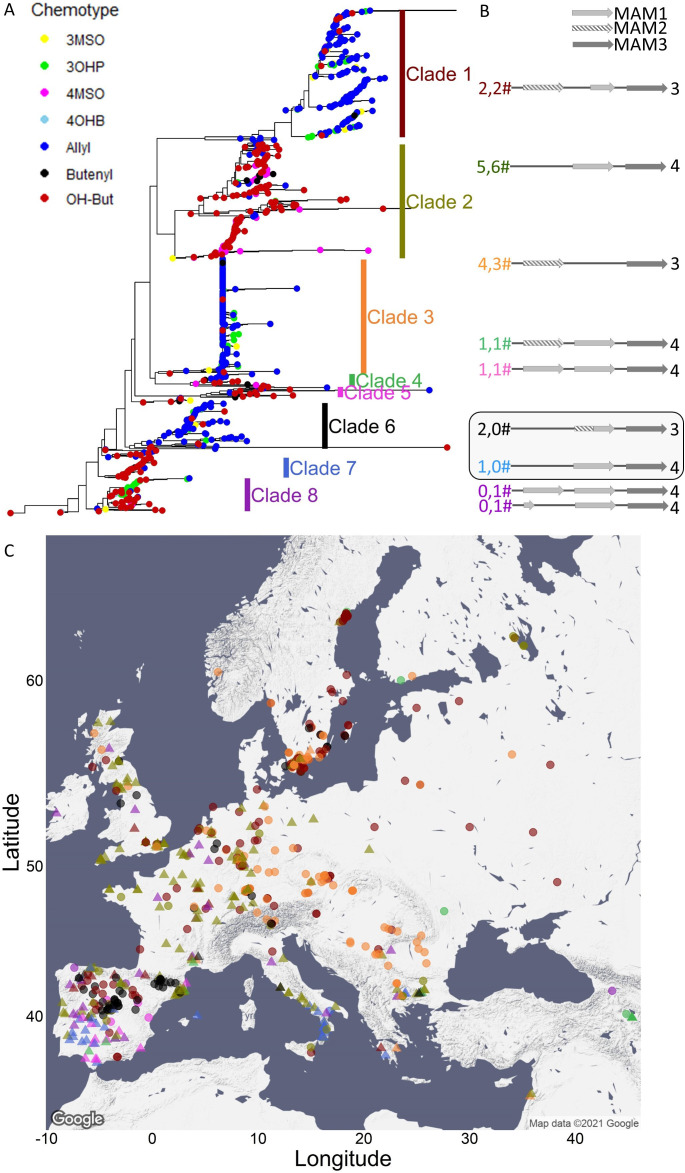
Figure 5.

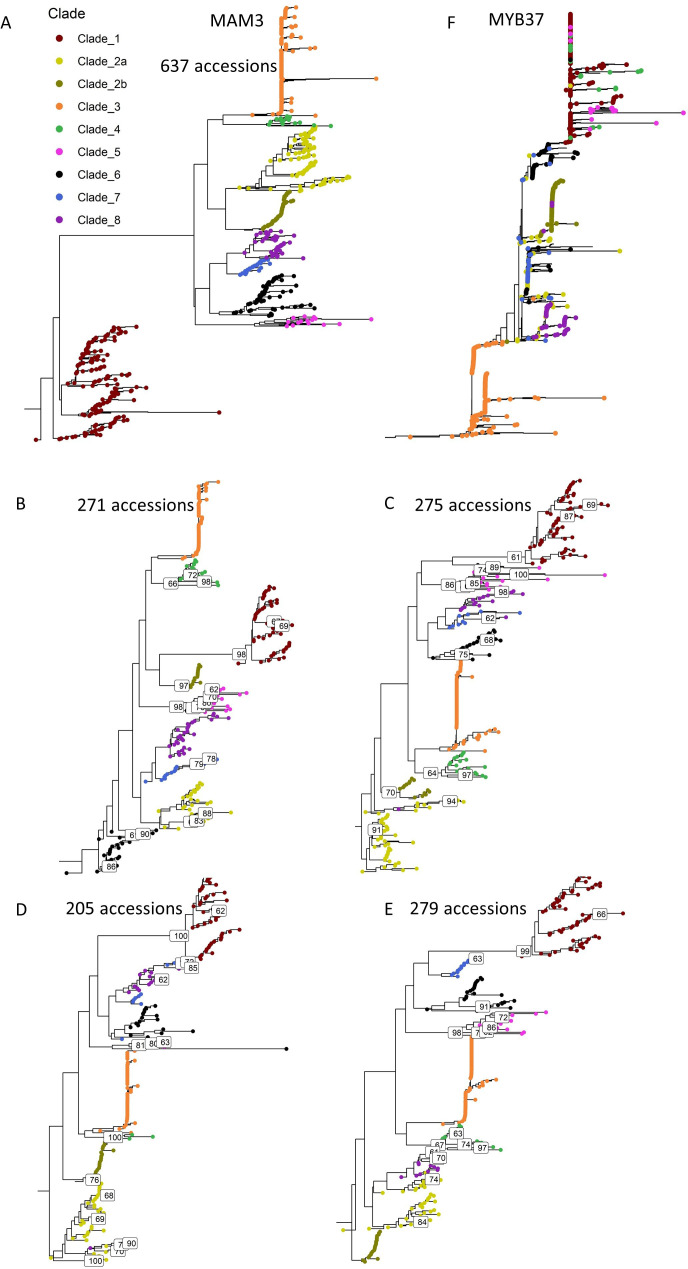
Figure 5—figure supplement 1. Support for the MAM3 tree clades classification.

Figure 5—figure supplement 1.

(A) MAM3 phylogeny of 637 Arabidopsis thaliana accessions, rooted by Arabidopsis lyrata MAMb, excluding accessions with low-quality sequences. (BE) MAM3 phylogeny of different combinations of A. thaliana accessions that were randomly chosen, rooted by A. lyrata MAMb. Bootstrap values >60 are indicated. In these trees, clade 2 was divided to two sub-clades. Clade’s MAM classification: clade 1, MAM2; clade 2, MAM1; clade 3, MAM2; clade 4, MAM1; clade 5, MAM1; clade 6, MAM2; clade 7, MAM1; clade 8, MAM1. (F) MYB37 phylogeny of A. thaliana accessions, rooted by the A. lyrate’s homologue (Al_scaffold_0006_2171, on chromosome 6), which is not shown because of distance. Tree tips are colored based on MAM3 clade’s classification as indicated in Figure 5A.
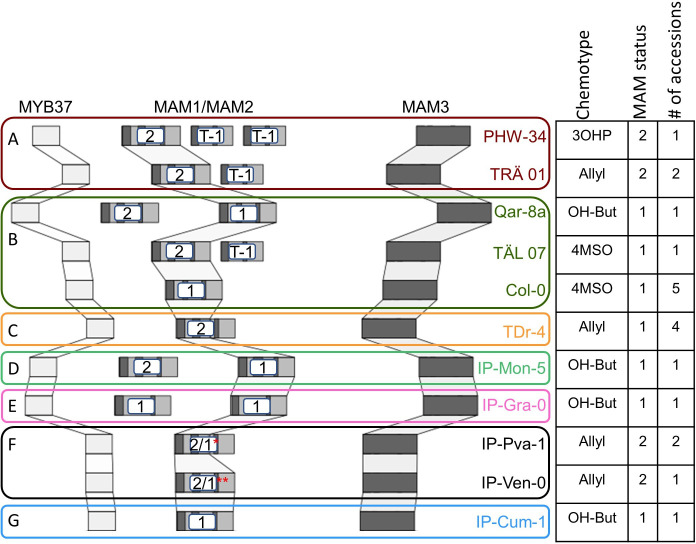
Figure 5—figure supplement 2. Genomic structure of the GS-Elong regions.

Figure 5—figure supplement 2.

The GS-Elong locus from different accessions was sequenced, and the MAM1 and MAM2 structures were analyzed. The table indicates the dominant chemotype of each accession, the MAM status of each accession, and the number of accessions with the same structure that were sequences in this work. (A) Clade 1. (B) Clade 2. (C) Clade 3. (D) Clade 4. (E) Clade 5. (F) Clade 6. (G) Clade 7. T-1: truncated MAM1 (contains ~66% of 3’ MAM1). *2/1: chimeric version that contain ~50% of 5’ MAM2 and ~50% 3’ MAM1. ** 2/1: chimeric version that contain ~20% of 5’ MAM2 and ~80% 3’ MAM1.
Figure 5—figure supplement 2—source data 1. Sequences of MAM locus.
Sequencing for the accessions in Figure 5—figure supplement 2 were generated. The extracted regions are 30000bps upstream of AT5G23000 (MYB37) and 60000 bps downstream of AT5G23020 (MAM3).
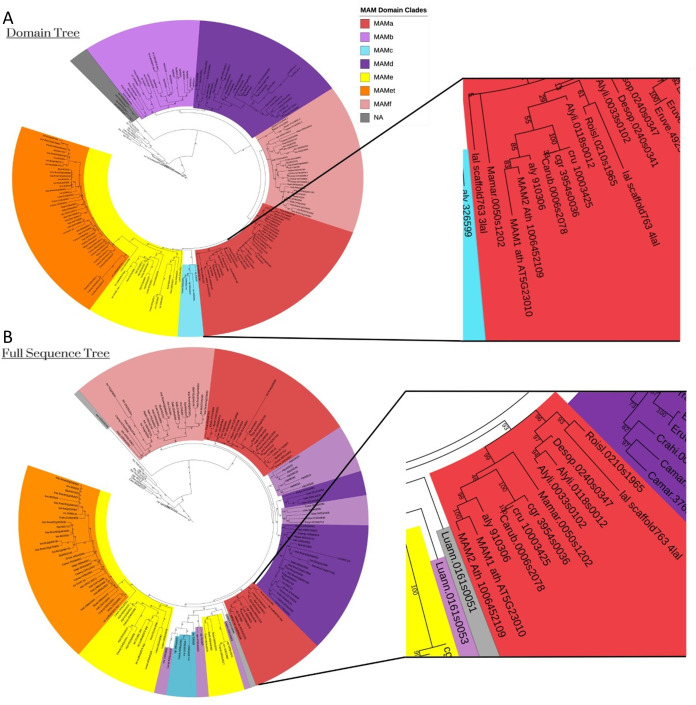
Figure 5—figure supplement 3. MAM2 is an Arabidopsis thaliana specific gene.

Figure 5—figure supplement 3.

Domain (A) and full sequence (B) amino acid phylogenies of the MAM/IPMS gene family. Sequences were taken from Abrahams et al., 2020, which uses Arabidopsis thalina Col-0 genome and the MAM2 amino acid sequence 1006452109 from the Arabidopsis Information Resource (TAIR) database. Both MAM1 and MAM2 fall within the MAMa domain clade. MAM1 and MAM2 are sister to each other in either tree, with the next closest MAM gene belonging to Arabidopsis lyrata. These results support a recent duplication event specific to Arabidopsis thaliana and subsequent divergence and specialization.
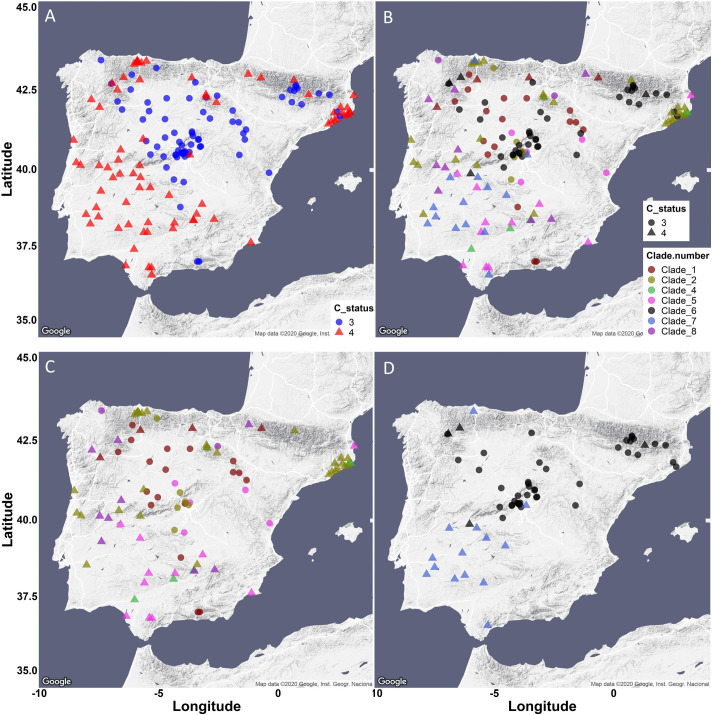
Figure 5—figure supplement 4. Iberia Peninsula presents low phenotypic variability and high genetic variation.

Figure 5—figure supplement 4.

(A) All accessions from Iberia were plotted, colored and shaped based on the side chain length of the aliphatic short chained GSLs. Accessions with a majority of GSLs containing 3 carbons in their side chains are classified as MAM2 dominant, colored in blue and indicated as circles. Accessions with the majority of aliphatic short chained GSLs containing 4 carbons in their side chains are classified as MAM1 dominant, colored in red and indicated as triangles. (B) All accessions from Iberia were plotted, colored based on their MAM3 clade classification, and shaped based on the side chain length. (C) All accessions from Iberia except clades 6 and 7 were plotted, colored based on their MAM3 clade classification, and shaped based on the side chain length. (D) Clades 6 and 7 from Iberia were plotted, colored based on their MAM3 clade classification, and shaped based on the side chain length.
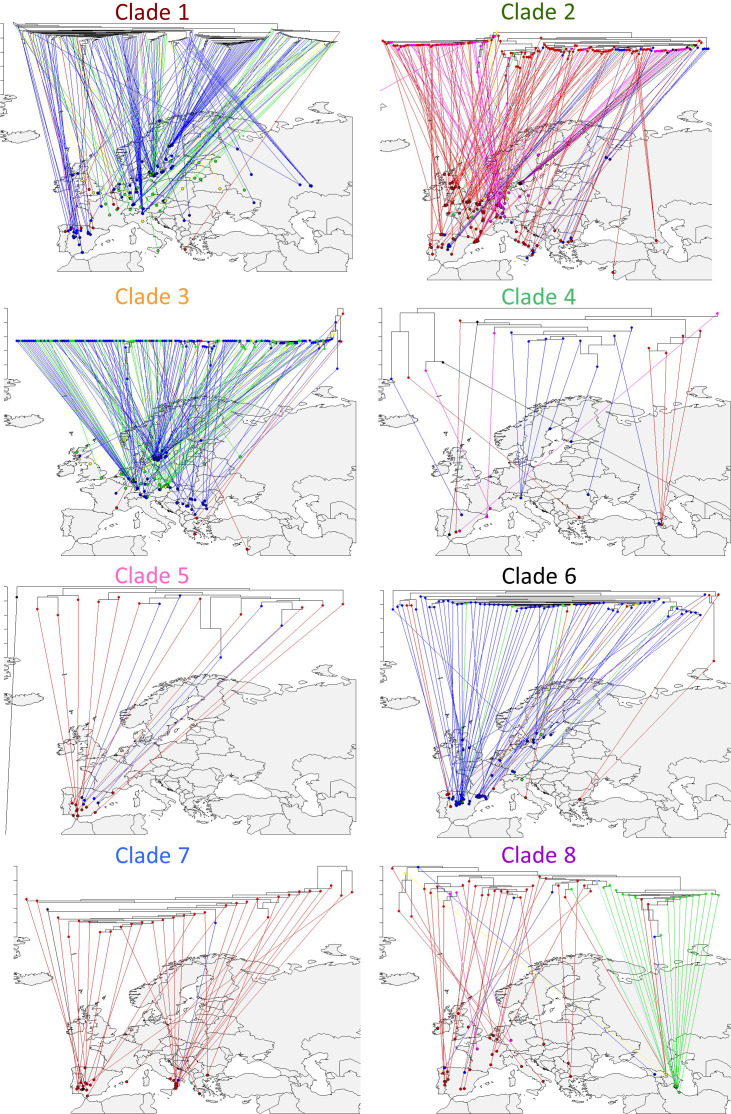
Figure 5—figure supplement 5. Geographic distribution of MAM haplotypes.

Figure 5—figure supplement 5.

The MAM phylogeny is split by the major clades/haplotypes and each sub-clade’s phylogeny is reflected on the map. Tree tips are colored based on the accessions chemotype.