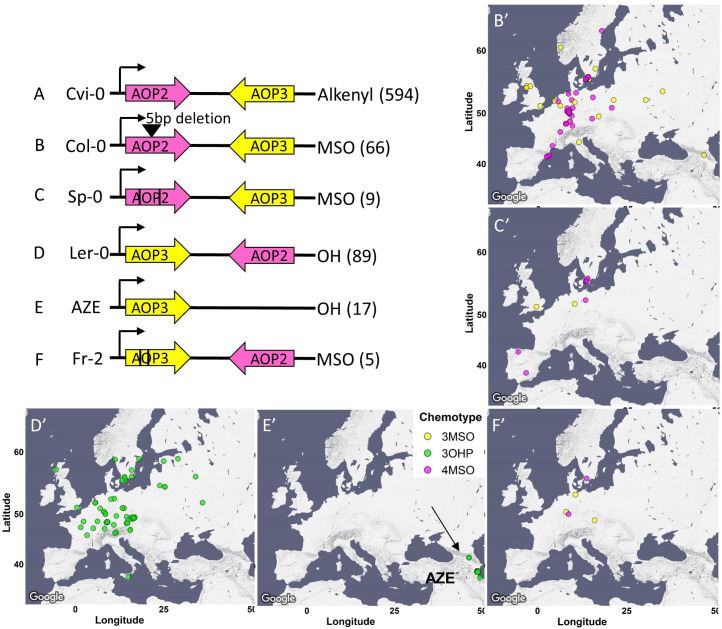
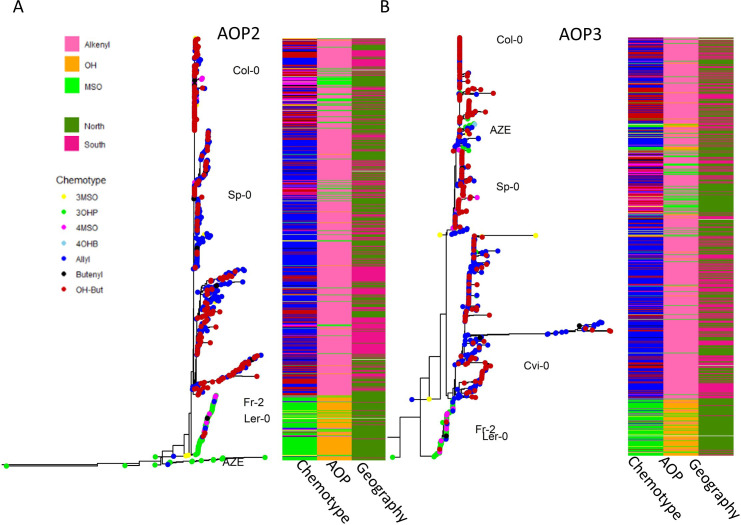
Figure 6. AOP genomic structure.
The genomic structure and causality of the major AOP2/AOP3 haplotypes are illustrated. Pink arrows show the AOP2 gene while yellow arrows represent AOP3. The black arrows represent the direction of transcription from the AOP2 promoter as defined in the Col-0 reference genome. Its position does not change in any of the regions. A-F represent the different structures. The black lines in C and F represent theoretical positions of independent variants creating premature stop codons. The GSL chemotype for each haplotype is listed to the right with the number of the accessions in brackets. The maps show the geographic distribution of the accessions from each structure.


