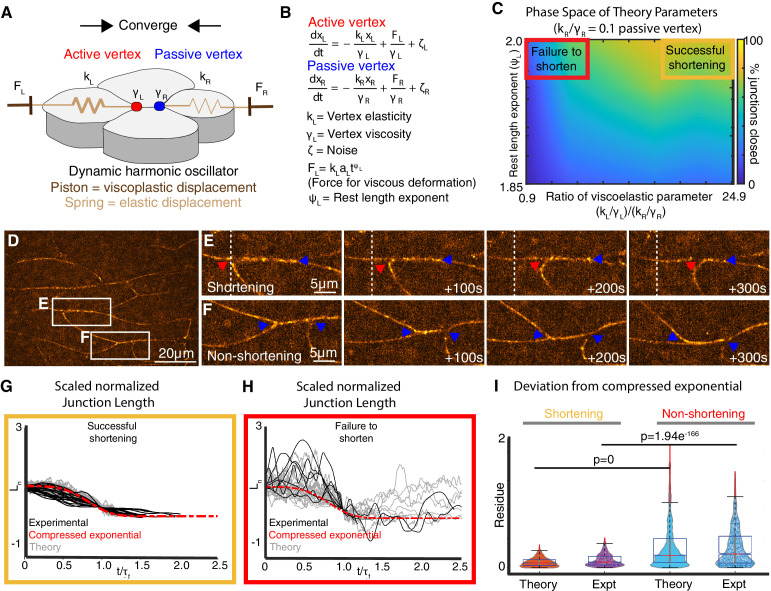
Figure 2. A new vertex model incorporating local mechanical heterogeneity recapitulates the fine-scale dynamics of junction shortening observed in vivo.
(A) Sketch of v- junction shortening with elements of the model overlain. Active (red) and passive (blue) vertex movements are affected by a piston modulating the dynamic rest length. The vertices execute elastic motion due to springs of elasticity, and . indices indicate left and right. The thicker spring indicates a stiffer elasticity constant, . (B) Equations of motion for active and passive vertex positions, and . Displacement of the left (right) vertex due to the piston is determined by the forces whose time dependence is determined by the rest length exponent,. The friction experienced by the left (right) vertices are modeled using is the colored noise term for the left vertex (Appendix, Section 4-6). (C) Heatmap indicating probability of successful junction shortening (legend at right) in parameter space for the viscoelastic parameter near vertices and the rest length exponent, staying within biologically reasonable values based on data from Drosophila (Solon et al., 2009; Appendix, Section 6). (D) Still image from a time-lapse of Xenopus CE. Insets indicate representative shortening and non-shortening junctions shown in Panels E and F (vertices indicated by arrowheads). (G) Normalized change in length, , for shortening junctions in vivo (black lines) and in simulations using asymmetric viscoelastic parameters (gray lines) resembling the compressed exponential form (red, dashed line) after the time axis is rescaled. (H) Normalized change in length, , for non-shortening junctions in vivo (black lines) and in simulations using symmetrical viscoelastic parameters (gray lines). (I) Quantification of relaxation behavior deviation from the compressed exponential using the residue (Appendix, Section 8-10).


